How to Log OPC UA Alarms to a Database

Open Automation Software Tags can be defined to connect to OPC UA Servers with the built in OPC UA Driver Interface. This tutorial walks you though downloading and installing OAS, configuring an OPC UA driver, configuring tags, configuring alarm limits and logging alarms to a database. Supported databases include SQL Server, Oracle, Access, PostgreSQL, Cassandra, MongoDB, MariaDB, SQLite, InfluxDB, MySQL, SQL Azure, Amazon Aurora, Amazon RDS, and CSV files.
Step 1. Download and Install the Open Automation Software and Start the OAS Service
If you have not already done so, you will need to download and install the OAS platform. Fully functional trial versions of the software are available for Windows, Windows IoT Core, Linux, Raspberry Pi and Docker on our downloads page.
On Windows run the downloaded Setup.exe file to install one or more of the Open Automation Software features. Select the default Typical installation if you are not sure what features to use or the Custom installation if you want to save disk space on the target system. When prompted agree to the End User License Agreement to continue the installation.
For more detailed instructions and video tutorials, visit the installation guide for your system:
Windows Installation | Linux Installation | Raspberry Pi Installation | Dockers Installation
The OAS Service Control application will appear when the installation finishes on Windows. Use this application to start the 3 Services. Run the Configure OAS application on Windows and select Configure-Tags; if the first time running, the AdminCreate utility will run to create an Administrator login as shown in Step 1 of Getting Started – Security.
Step 2. Configure Your OPC UA Data Source
- First, you will need to open the Configure OAS application from the program group Open Automation Software.
- Select Configure >> License from the top menu and verify that OPC UA is one of the available Drivers in the lower left of the form. The demo license will have this by default. If you do not see OPC UA available, contact support@openautomationsoftware.com to update your license.
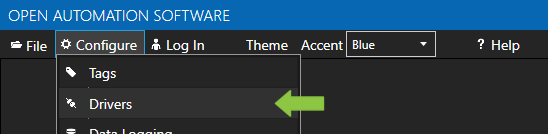
- Select Configure >> Drivers from the top menu.
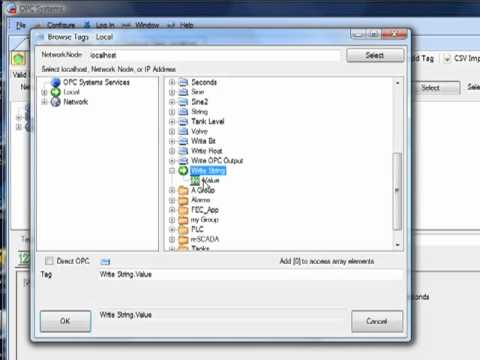
- Select localhost or the remote service you wish to modify with the Select button to the right of the Network Node list.

- The Configure Drivers Screen will appear. Select OPC UA from the Driver dropdown box.
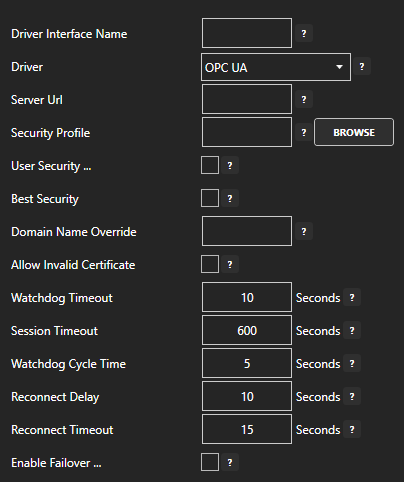
- Enter a meaningful Driver Interface Name that you will refer to this physical connection when defining Tags with a OPC UA Data Source.
- Define the properties for the desired physical connection.
- Click the Add Driver button above the Driver list in the left pane to add the Driver Interface as an available selection when defining Tags in the next step.
For more detailed instructions on configuring your OPC DA data source, click here to see our Getting Started OPC UA tutorial.
Step 3. Configure Your Tags
OAS provides multiple ways to add and define tags:
- Manually add and define Tags using the Configure OAS application. …learn more…
- CSV Import and Export …learn more…
- Programatically …learn more…
- One Click Allen Bradley …learn more…
- One Click OPC …learn more…
To add a Tag manually:
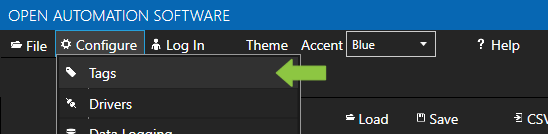
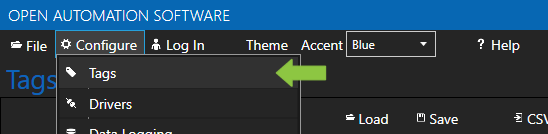
- In the OAS Configure Application, select Configure >> Tags from the top menu.
- Select localhost or the remote service you wish to modify with the Select button to the right of the Network Node list.
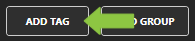
- Click on the Add Tag button located at the top of the Tag browser on the left portion of the screen.
- A dialog box will appear. Enter a name for your new tag and click ok.
- A configuration screen will appear for your new tag. Select your data source type in in the Data Source dropdown box.
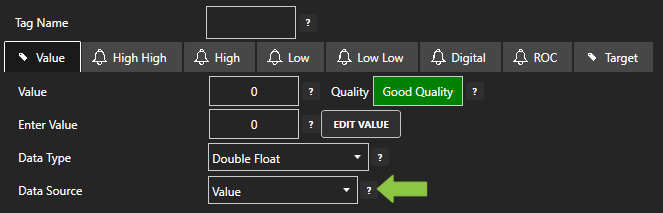
- Specify the correct data type in the Data Type dropdown box.
- Click Apply Changes at the bottom right of the window.
For more detailed instructions on configuring your tags, click here to see our Getting Started Tags tutorial.
Step 4. Configure Alarm Limits
- In the OAS Configure Application, select Configure >> Tags from the top menu.
- Select localhost or the remote service you wish to modify with the Select button to the right of the Network Node list.
- Select the tag you wish to set alarm limits for from the tag browser on the left.
- Use the tabs at the top of the tag properties window to configure alarm limits for your tag based on type: High High, High, Low, Low Low, Digital and Rate of Change.

- Check the Enable Alarm checkbox to enabling your alarm limit; alternately, you can use he Enable with Tag…checkbox.
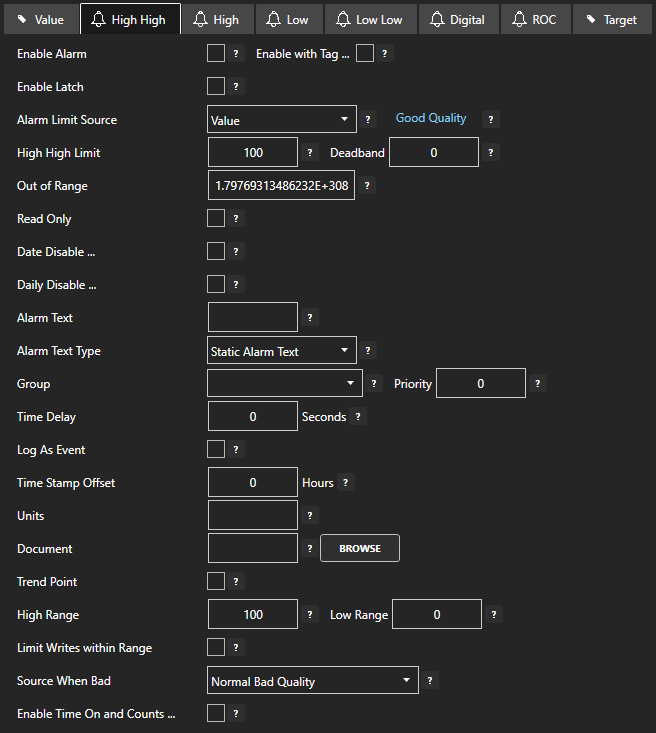
- Set your Alarm Limit Source with the dropdown box. If you choose Value, enter the value in the provided text field.
- When you have finished configuring your alarm limits, click Apply Changes in the bottom right of the properties window.
For More detailed instructions on Configuring Alarm Limits, visit our Alarm Limits tutorial or watch the video below:
Step 5. Configure Alarm Logging
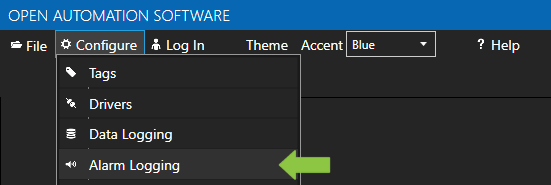
- In the OAS Configure Application, select Configure >> Alarm Logging from the top menu.
- Select localhost or the remote service you wish to log alarms from with the Select button to the right of the Network Node list.
- A Logging Group screen will appear.
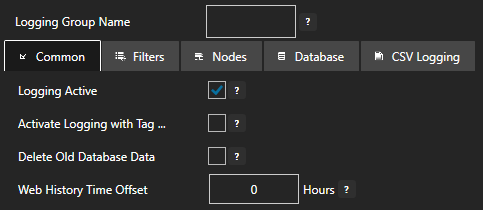
- In the Common tab, check the Logging Active checkbox to enable your group. Alternately, you can activate logging with a tag by checking that box.
- Use the Filters tab to select which alarms you wish to log with your group. Filtering can be done by alarm state, alarm limit, priority, groups and alarm type.
- In the Database tab, you will select what type of database you will be logging to and enter the connection parameters. OAS can log to SQL Server, Oracle, Access, PostgreSQL, Cassandra, MongoDB, MariaDB, SQLite, InfluxDB, and MySQL.
- If you wish to log to CSV, you would configure that in the CVS Logging tab.
- When you have finished configuring your logging group, click Add Group in the left panel to add your new group to the service.
For more detailed instructions on Configuring Alarm Logging, visit our Getting Started – Alarm Logging tutorial or watch the video below:
