High CPU Usage
Below are some common causes of high CPU usage by the OAS Engine and how to resolve them:
Cause
AB or Siemens controllers are offline.
Solution
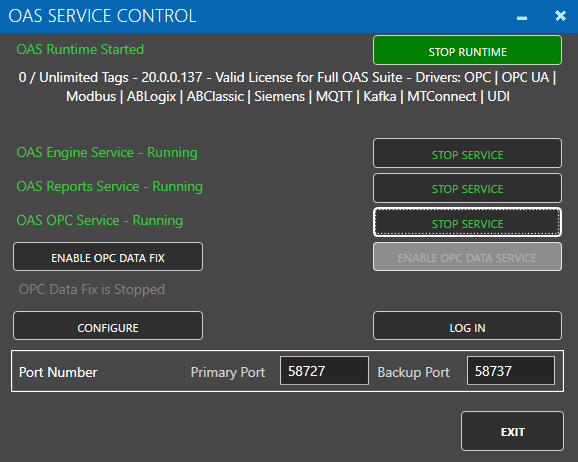
Update OAS to version 20.0.0.137 or greater.
Cause
Large number of data buffer files in Store and Forward directory defined under Configure-Options-Store and Forward.
Solution
Update OAS to version 20.0.0.40 or greater. Additionally resolve issue with data logging, alarm logging, MQTT, Azure IoT, AWS IoT Core, or Kafka connectivity that is causing data to be buffered.
Cause
Operating system disk with no space remaining.
Solution
Free up disk space.
Cause
When Log Network Transactions is enabled under Configure-Options-Systems Logging and there is high network traffic from client applications the logging buffer can be overrun and not keep up with recording the transactions to disk. Log Network Transactions should only be used for short troubleshooting sessions to track all data send to all clients.
Solution
Disable Log Network Transactions under Configure-Options-System Logging. This logging feature has been removed if it is not listed under Configure-Options.
Analyze OAS Engine with JetBrains dotTrace
JetBrains dotTrace tool is a good tool to help identify what is causing high CPU usage. Following are the steps to use dotTrace.
Step 1: Download portable version of dotTrace by JetBrains.
Visit https://www.jetbrains.com/profiler/download/#section=portable
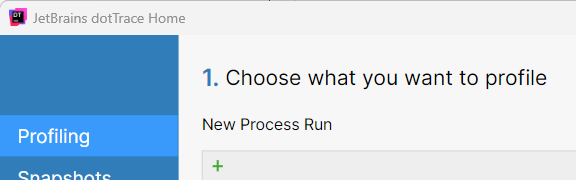
Step 2: Attach OAS Engine Windows Service.
Click the green plus sign under New Process Run to add a run configuration.
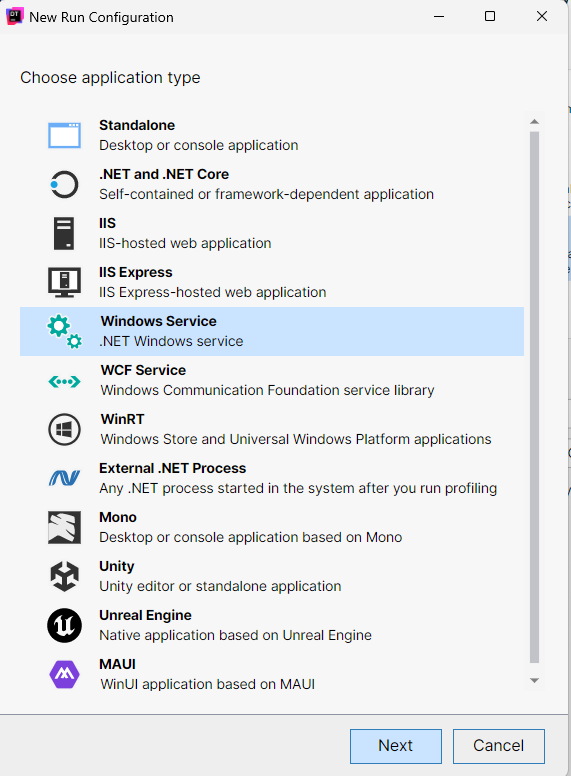
Choose Windows Service and select Next.
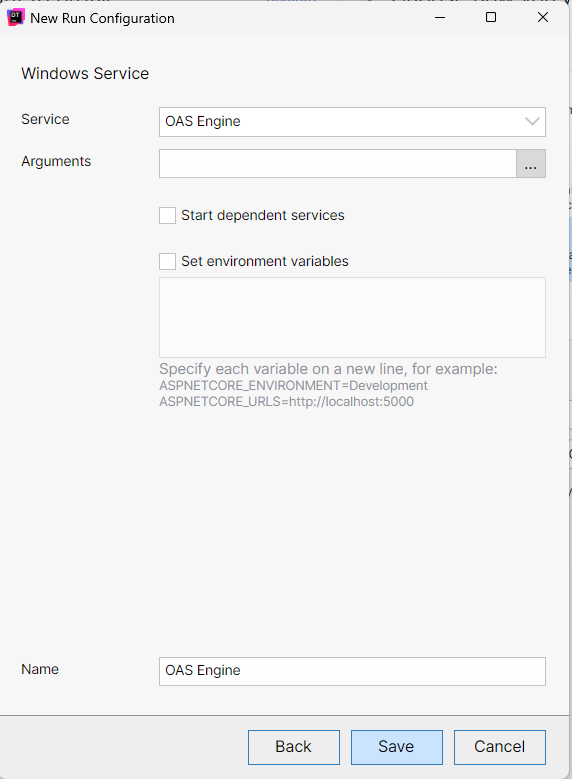
Sect the Service to OAS Engine from the pulldown selection. Click Save to add the run configuration.
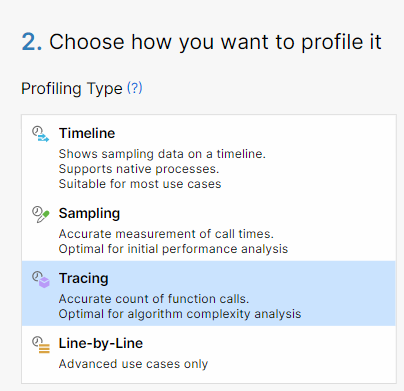
Step 3: Start a profiling session.
Save all OAS Configurations. The OAS Engine Service will restart when a profiling session begins.
Select Tracing as the Profiling Type.
Uncheck Collect profiling data from Start.
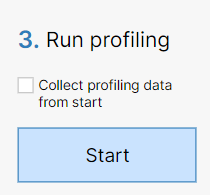
Select Start. This will cause the OAS Engine service to restart.
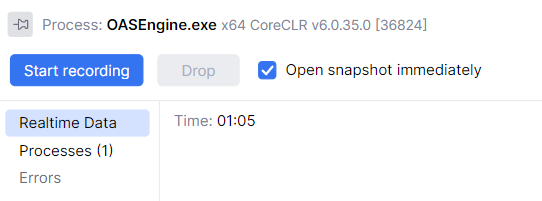
Wait for the OAS Engine to cause high CPU usages.
Select Start recording.
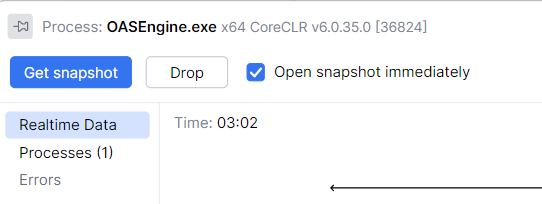
Wait 30 seconds, then select Get snapshot.
Select User code in Filters Subsystems.
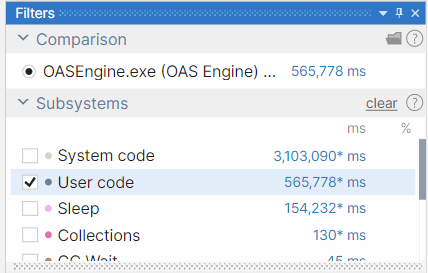
The processes that consume the most CPU time will appear at the top of the Call Stack window.
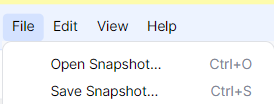
Select File-Save Snapshot and send to Open Automation Software support.
Step 4: Stop profiling session.
Select Stop from the Process window.

Start the OAS Engine service.
<< View All Troubleshooting Topics