Troubleshooting – General
Below are some common causes of high CPU usage by the OAS Engine and how to resolve them:
Cause
AB or Siemens controllers are offline.
Solution
Update OAS to version 20.0.0.137 or greater.
Cause
Large number of data buffer files in Store and Forward directory defined under Configure-Options-Store and Forward.
Solution
Update OAS to version 20.0.0.40 or greater. Additionally resolve issue with data logging, alarm logging, MQTT, Azure IoT, AWS IoT Core, or Kafka connectivity that is causing data to be buffered.
Cause
Operating system disk with no space remaining.
Solution
Free up disk space.
Cause
When Log Network Transactions is enabled under Configure-Options-Systems Logging and there is high network traffic from client applications the logging buffer can be overrun and not keep up with recording the transactions to disk. Log Network Transactions should only be used for short troubleshooting sessions to track all data send to all clients.
Solution
Disable Log Network Transactions under Configure-Options-System Logging. This logging feature has been removed if it is not listed under Configure-Options.
Analyze OAS Engine with JetBrains dotTrace
JetBrains dotTrace tool is a good tool to help identify what is causing high CPU usage. Following are the steps to use dotTrace.
Step 1: Download portable version of dotTrace by JetBrains.
Visit https://www.jetbrains.com/profiler/download/#section=portable
Step 2: Attach OAS Engine Windows Service.
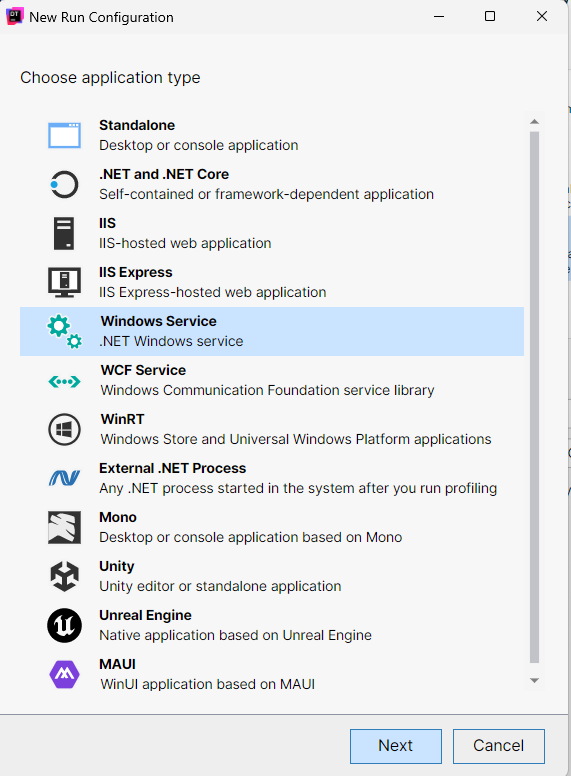
Click the green plus sign under New Process Run to add a run configuration.

Choose Windows Service and select Next.
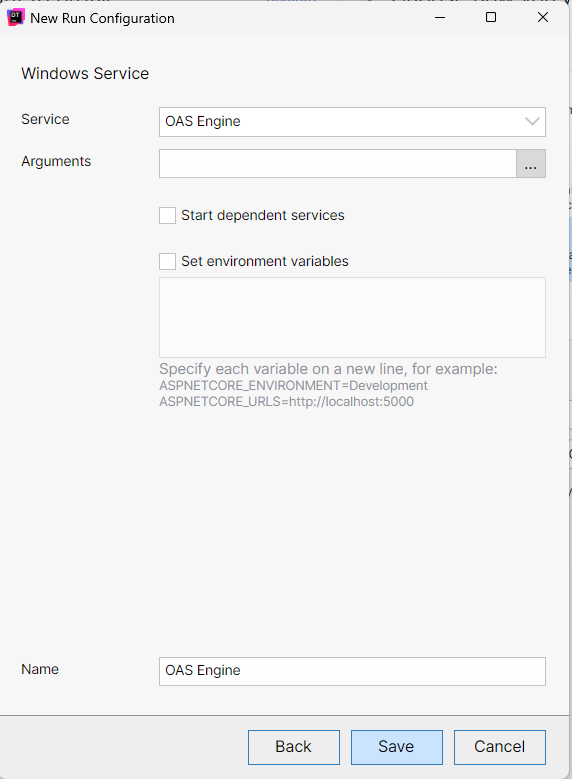
Sect the Service to OAS Engine from the pulldown selection. Click Save to add the run configuration.
Step 3: Start a profiling session.
Save all OAS Configurations. The OAS Engine Service will restart when a profiling session begins.
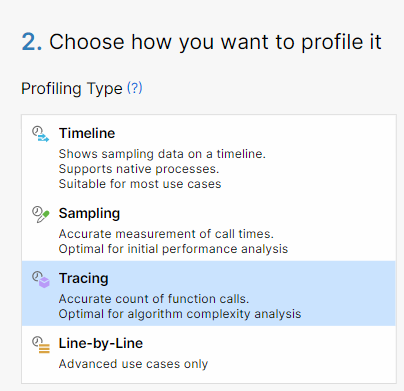
Select Tracing as the Profiling Type.
Uncheck Collect profiling data from Start.
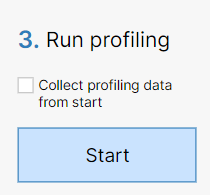
Select Start. This will cause the OAS Engine service to restart.
Wait for the OAS Engine to cause high CPU usages.
Select Start recording.
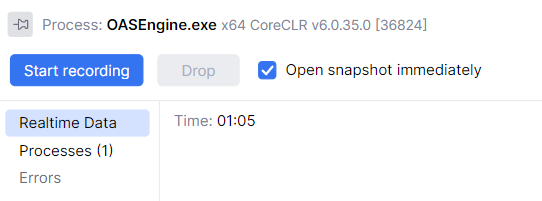
Wait 30 seconds, then select Get snapshot.
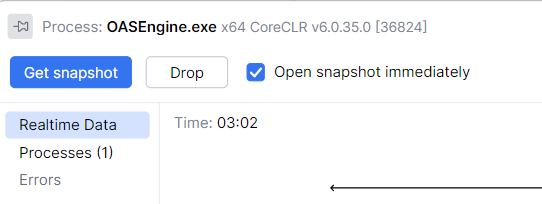
Select User code in Filters Subsystems.
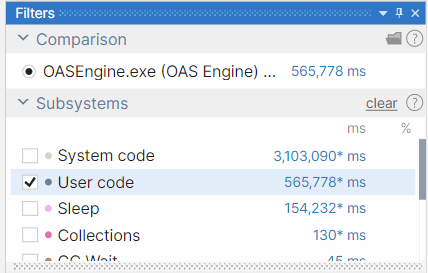
The processes that consume the most CPU time will appear at the top of the Call Stack window.
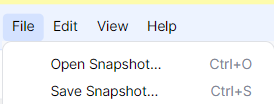
Select File-Save Snapshot and send to Open Automation Software support.
Step 4: Stop profiling session.
Select Stop from the Process window.

Start the OAS Engine service.
Below are some common memory management issues and how to resolve them:
Cause
Data logging or alarm logging errors returned from the database engine when Store and Forward to Disk is disabled. You will see a warning that store and forward to disk needs to be enabled under Configure-System Errors.
Solution
Go to Configure-Options-Store and Forward and enable Store Buffer to Disk.
Cause
Data logging from a remote data source engine when Store and Forward to Disk is disabled.
Solution
Go to Configure-Options-Store and Forward and enable Store Buffer to Disk on the data source engine.
Cause
Remote data logging from a data source engine that does not have license of data logging will data buffering in the data source that cannot be resolved. You will see a warning of this under Configure-System Errors.
Solution
Disable the remote data logging and restart the data source engine or update the data source engine to OAS version 17.0.0.5 or greater.
Cause
Larger number of tags enabled for real time trending.
Solution
Change the Longest Realtime Time Frame under Configure-Options-Trending to 3600 seconds.
Cause
High number of clients subscribed to large number of tags that are changing frequently. This would include but not limited to high number of .NET applications, remote OAS Engines, remote OAS OPC UA server, remote OAS OPC DA server, OAS Excel, remote data logging.
Solution
Update the OAS Engine to version 20.0.0.103 or greater. Improved networking with multiple clients. Increases data delivery speed and reduces memory load when multiple clients are connected.
Cause
Driver Interface setup to OPC UA servers that are offline. You will see communication errors under Configure-System Errors of the OPC UA server driver interface being offline.
Solution
Update the OAS Engine to version 16.0.0.101 or greater.
Cause
Large number tags using statistic calculation functions of AVG, MOVMIN, MOVMAX, and MOVSUM for a long time period. See the total in use under Configure-System Status.
Solution
Log data to a database and use the recipe feature with aggregate field names of SUM(fieldname), AVG(fieldname), MIN(fieldname), and MAX(fieldname).
Cause
Operating system disk with no space remaining.
Solution
Free up disk space for database engine and OAS CSV logging and error recording.
Cause
MQTT, Azure IoT, AWS IoT Gateway with Store and Forward enabled in driver interface with network error to cloud service.
Solution
Go to Configure-Options-Store and Forward and enable Store Buffer to Disk.
Cause
Large number of Time On and Counts enabled with long Period 1 and Period 2 times defined with data changing frequently.
Solution
Reduce Period 1 and Period 2 times of the Time On and Counts or log events with data change logging group and use recipe feature with COUNT(fieldname) aggregate to return the number of transitions.
Cause
Retain All Realtime Alarms to Show All Occurrences in Window enabled under Configure-Options-Alarms with long retention time.
Solution
Disable Retain All Realtime Alarms to Show All Occurrences or shorten the time retained with the property Remove Old Alarms from Realtime Alarms under Configure-Options-Alarms. 0 is unlimited time which is the default.
Cause
When Log Network Transactions is enabled under Configure-Options-Systems Logging and there is high network traffic from client applications the logging buffer can be overrun and not keep up with recording the transactions to disk. Log Network Transactions should only be used for short troubleshooting sessions to track all data send to all clients.
Solution
Disable Log Network Transactions under Configure-Options-System Logging. This logging feature has been removed if it is not listed under Configure-Options.
Use dotMemory Profiler by JetBrains
dotMemory by JetBrains is an excellent tool for identifying what is the source of memory allocation. This will help identify what source of the memory usage is.
Download Jet Brains Memory Profiler: https://www.jetbrains.com/dotmemory
Following are the steps to create a snapshot.
Restart the OAS Services.
Start JetBrains dotMemory.
Select Show processes of all users.

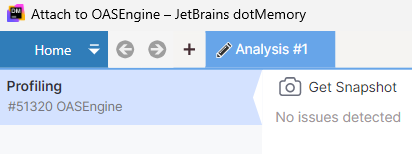
Double-click on OASEngine.exe x64 process to attach to it.
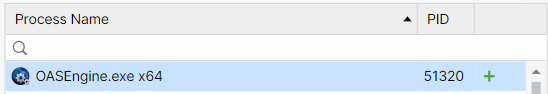
Memory profiling will begin.
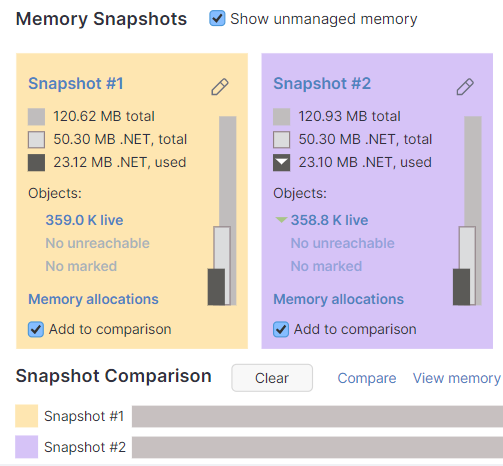
Select Get Snapshot to create the first snapshot of memory.
The first snapshot will appear after all information is collected.
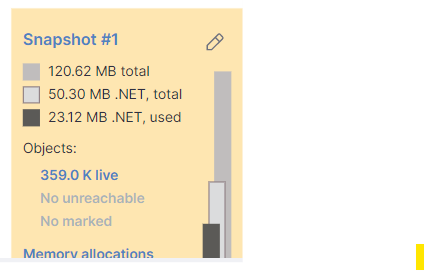
Wait until the memory usage of the OAS Engine has increased by 50% or more.
Select Get Snapshot again to create the second snapshot.
Select Detach.

Under the Home menu select Export Workspace.
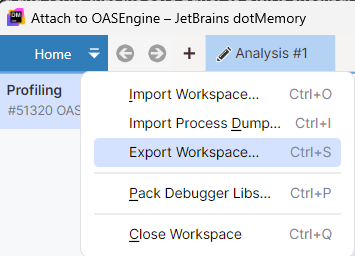
Upload the file to link provided by OAS support team.
To see common causes of high memory usage view Memory Management troubleshooting guide.
Once cause of high memory usage is unresolved data logging or alarm logging errors, or Excel has a CSV file open that is currently being logged to.
Go to Configure-Options-Store and Forward and enable data buffering to disk.
View the following video on how to setup data logging and alarm logging so there is no data loss on a network or database engine failure:
<< View All Troubleshooting Topics