How to Log Kafka Alarms to PostgreSQL
Open Automation Software can be configured to connect to Kafka using the Kafka connector, trigger alarms and log them to a PostgreSQL database. This guide walks you through downloading and installing OAS, configuring a Kafka connector, configuring tags, setting an alarm limit and configuring alarm logging to PostgreSQL.
For this guide on how to log Kafka alarms to PostgreSQL you will need:
- A PostgreSQL server and database
- Docker installed in Linux or Windows including the docker-compose utility
Info
If you have your own Kafka cluster deployed you can skip the steps for creating a Kafka cluster.
1 - Download and Install OAS
If you have not already done so, you will need to download and install the OAS platform.
Fully functional trial versions of the software are available for Windows, Windows IoT Core, Linux, Raspberry Pi and Docker on our downloads page.
On Windows, run the downloaded setup.exe file to install the Open Automation Software platform. For a default installation, Agree to the End User License Agreement and then click the Next button on each of the installation steps until it has completed.
If you'd like to customize your installation or learn more, use the following instructions:
The OAS Service Control application will appear when the installation finishes on Windows.
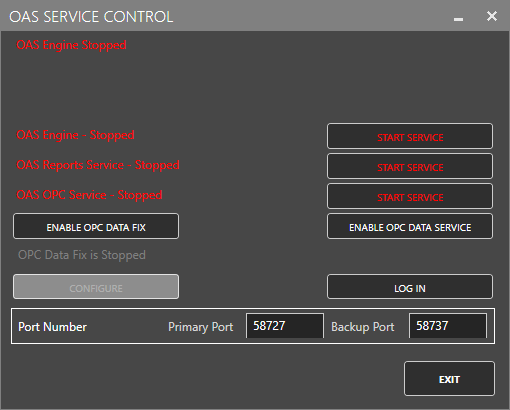
Click on each START SERVICE button to start each of the three OAS services.
2 - Configure OAS
Web Configuration Application
Configuration of the OAS server is performed from the built-in Web Configuration Application. This is the main application for accessing any settings within the OAS server and is completely self-contained within the server.

You can reach this by opening your browser to:
http://<your server>:58725/app/config
If you are browsing from the OAS machine itself, you can use localhost, otherwise use the IP address of the machine. You will also need to ensure port 58725 is open on both the client and the server or you may not be able to reach the application.
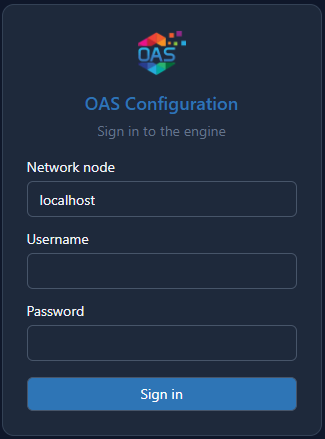
On a new installation the OAS engine has no accounts yet, so the first screen you see is Create Admin Account. Once the administrator account exists that screen is not shown again, and browsing to the application displays the sign in screen instead.
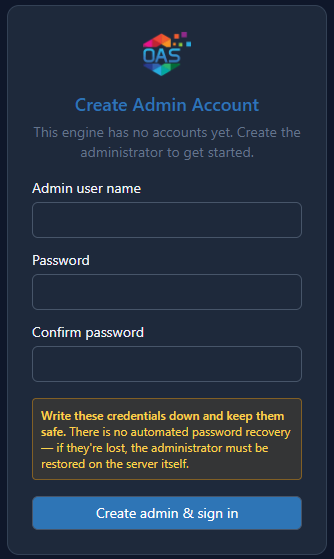
Enter a name for the administrator in the Admin user name field. Typically you would use
admin, but you can use whatever name you choose.Enter a password in the Password field, then enter the same password again in the Confirm password field.
Click on the Create admin & sign in button. The account is created and you are signed in to the engine.
Warning
Write these credentials down and keep them safe. There is no automated password recovery. If they are lost, the administrator must be restored on the server itself.
To sign in from then on, enter the Network node of the OAS engine, then the Username and Password of your account, and click on the Sign in button.
Info
In this guide you will use the Web Configuration Application to configure the local Node which by default is localhost.
If you have installed OAS on a remote instance you can also connect to the remote instance by setting the relevant IP address or host name in the Node field.
Important
Eventually the Legacy Desktop Configuration Application will be retired, but it is currently still available and shipped with the OAS product installation. If you choose to use it, instructions for accessing it are below. Documentation in the Knowledge Base will be replaced with the Web Application when it is retired.
Legacy Configuration Application
From your operating system start menu, open the Configure OAS application.
Select the Configure > Tags screen.
Important
If this is the first time you have installed OAS, the AdminCreate utility will run when you select a screen in the Configure menu. This will ask you to create a username and password for the admin user. This user will have full permissions in the OAS platform.
For further information see Getting Started - Security.
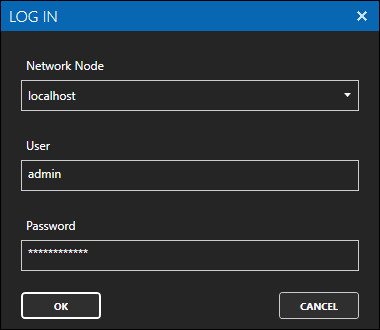
If this is the first time you are logging in, you will see the AdminCreate utility. Follow the prompts to set up your admin account. Otherwise, select the Log In menu button and provide the Network Node, username and password.

3 - Create a Kafka test cluster using Docker
In this step you will create a local Kafka cluster. To simplify the deployment you will need to have Docker installed including the docker-compose utility. This method allows you to create a cluster very quickly for testing purposes and remove it again when you are done.
Create a new folder such as Kafka and inside the folder create a new
docker-compose.ymlfile with the following definition.services: zookeeper: image: confluentinc/cp-zookeeper:latest container_name: zookeeper ports: - "2181:2181" environment: ZOOKEEPER_CLIENT_PORT: 2181 ZOOKEEPER_TICK_TIME: 2000 kafka: image: confluentinc/cp-kafka:latest container_name: kafka ports: - "9092:9092" environment: KAFKA_BROKER_ID: 1 KAFKA_ZOOKEEPER_CONNECT: zookeeper:2181 KAFKA_ADVERTISED_LISTENERS: PLAINTEXT://localhost:9092 KAFKA_LISTENER_SECURITY_PROTOCOL_MAP: PLAINTEXT:PLAINTEXT KAFKA_OFFSETS_TOPIC_REPLICATION_FACTOR: 1Open a command line or bash terminal in the Kafka folder and use the following command to start a new container. This will download the image and all its dependencies and may take a few minutes.
docker-compose up -dCreate a new topic called temperature using the following command.
docker exec kafka kafka-topics --create --topic temperature --bootstrap-server localhost:9092 --partitions 1 --replication-factor 1
Info
Once you are done testing, you can stop and remove the containers that you created by using the following command:
docker-compose down
4 - Configure Kafka Consumer
In the following steps you will create and configure a Kafka Connector connecting to a local Kafka cluster on port 9092. This connector will act as a Consumer where Tags can subscribe to a topic in the cluster.
Select Drivers in the sidebar.
Click + Add, enter a meaningful Driver Interface Name to give this driver interface instance a unique name (for example Kafka Consumer), and click Create. Once created, the driver interface name should appear in the list of drivers.
Ensure the following parameters are configured:
- Driver: Kafka
- Bootstrap Servers: localhost:9092
- Security Protocol: Plaintext
- Client Id: oas-kafka
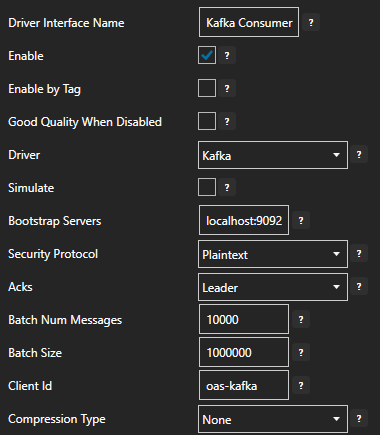
The app flags the Bootstrap Servers field because it is still the default
localhost:9092. That is the address of the local test cluster you created, so leave it as it is. Change it if your broker is on another host or port.Turn on Enable and click on the Apply changes button. The driver interface is not active until it is enabled and the changes are applied.
5 - Assign Kafka as Tag Data Source
You will now set the Tag's data source to the Kafka driver interface that you created previously.
Select the Tag that will source data from a Kafka data source.
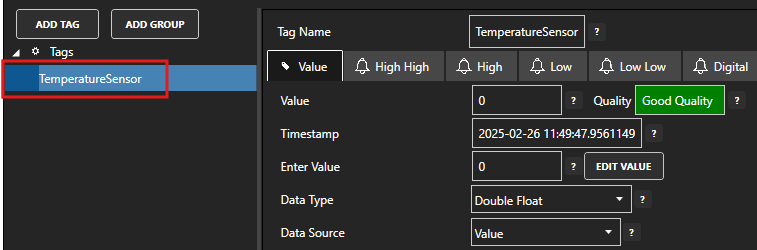
Set the Data Source to Kafka.
Set the Select Driver Interface drop-down to the Kafka Consumer interface created previously.
Set the Topic to temperature. This is the topic that you created previously when setting up the local Kafka cluster.
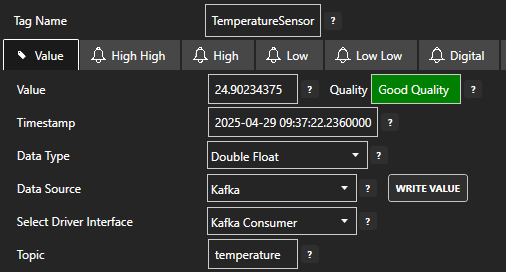
Click on the Apply changes button to apply the changes.
To publish a data value from your Kafka cluster, you can use the following command.
docker exec -i kafka kafka-console-producer --topic temperature --bootstrap-server localhost:9092You can now type in any data such as a numeric value and it will be published to the temperature topic.
Check that the quality status is Good and the Tag value is as expected.

6 - Set Tag Alarm Limit
Select the Tag where you want to enable the alarm limit.
Expand the High section to open the high alarm limit configuration.

Configure the following setting to enable the high alarm limit:
- Turn on Enable Alarm
- Set the High Limit value to your desired value threshold for triggering the alarm
Optionally you can also configure:
- Alarm Text to customize the alarm text that will be shown. You can combine this with different Alarm Text Type settings in order to prepend, append, overwrite or replace the alarm text with a calculation.
- Group to categorize the alarm into a specific group. This can be used to filter alarms when configuring logging and notifications.
- Priority to order and apply a specific priority to each alarm.
- Time Delay which suppresses the alarm for the specified amount of time after it is triggered.
- Log As Event which means the alarm will only be recorded as a single instance without an acknowledgement state.
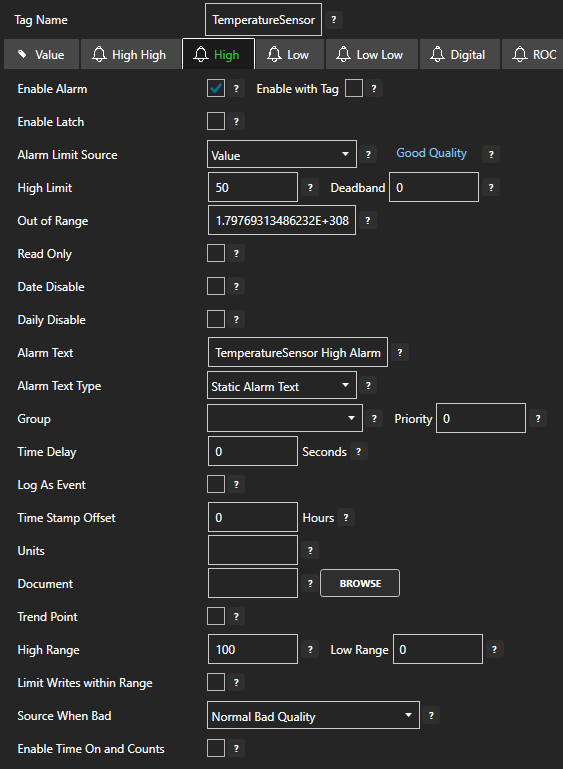
Click on the Apply changes button to apply the alarm limit configuration.
7 - Configure Alarm Logging to PostgreSQL
You will now configure alarm logging to a PostgreSQL database.
Select Alarm Logging in the sidebar.
Click + Add, enter a meaningful Logging Group Name to give this alarm logging group a unique name, and click Create. Once created, the alarm logging group name should appear in the list of logging groups. An alarm logging group is defined by a specified filter, OAS node list (default localhost) and database connection or CSV file configuration.
In the Common section turn on Logging Active. New logging groups are created inactive, so this is what makes the logging group active. Leave the remaining values at their defaults.
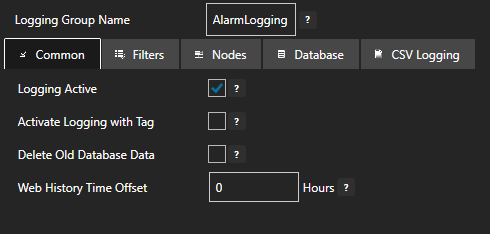
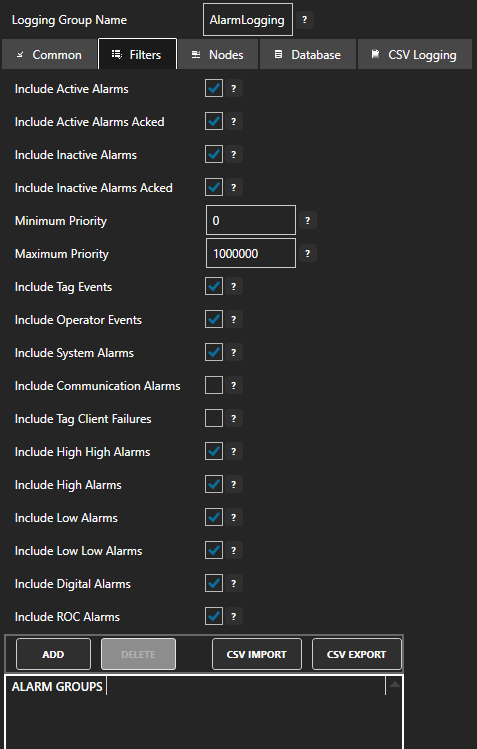
In the Filters section you can customize which alarms should be included in your logging. This includes filtering by:
- Alarm state
- Alarm priority
- Alarm type
- Alarm group
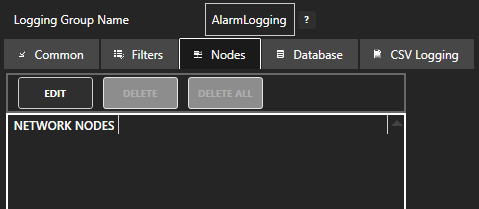
In the Nodes section you can leave the default settings if you only want to include alarms generated on the local node. The localhost node is added to the list automatically.
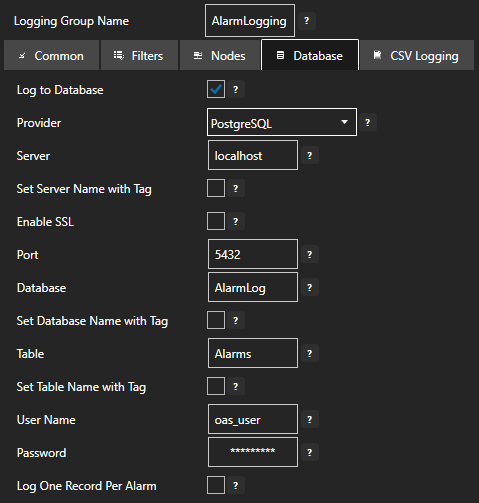
In the Database section you will configure the database type and connection parameters:
- Turn on Log to Database to enable logging to a database
- Set Provider to PostgreSQL
- Set Server to your PostgreSQL server (e.g., localhost)
- Set Database to AlarmLog
- Set Table to a table name such as Alarms
- Set User Name to a user with permissions to manage the AlarmLog database
- Set Password to the user password
Click on the Apply changes button to apply the alarm logging group configuration.
Your alarm logging group is now active.
8 - Save Changes
Once you have successfully configured your OAS instances, make sure you save your configuration.
On each configuration page that has a Save button, click on it.
If this is the first time you are saving the configuration, or if you are changing the name of the configuration file, OAS will ask you if you want to change the default configuration file.
If you select Yes then OAS will make this configuration file the default and if the OAS service is restarted then this file will be loaded on start-up.
If you select No then OAS will still save your configuration file, but it will not be the default file that is loaded on start-up.
Important
Each configuration screen has an independent configuration file except for the Tags and Drivers configurations, which share the same configuration file. It is still important to click on the Save button whenever you make any changes on those screens.
The Security, Users and Options screens have no Save button. Changes you make there are written to disk as soon as you make them, so there is nothing further to save.
For more information see: Save and Load Configuration
Info
- On Windows the configuration files are stored in C:\ProgramData\OpenAutomationSoftware\ConfigFiles.
- On Linux the configuration files are stored in the ConfigFiles subfolder of the OAS installation path.
Ready to get started?
See how OAS fits your environment, or get pricing for your project.