For high speed applications with data frequency up to 100 nanoseconds, or remote systems with intermittent connectivity data can be buffered in the device and logged easily using Open Automation Software with the following guide. OAS can log this buffered data in a wide table format to a database or CSV file. This can be done with arrays or data queues in the controller.
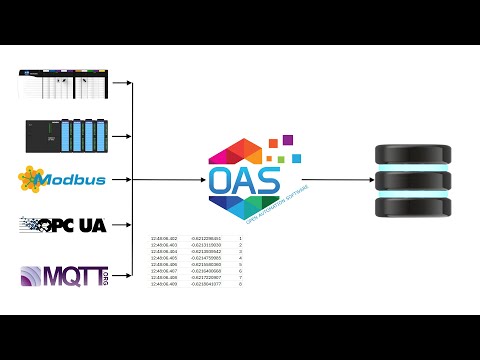
View the following video for a complete demonstration on how to log 1 millisecond data from a controller:
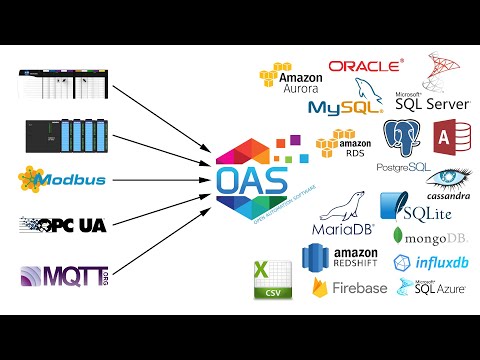
This feature can be used with all data sources including Allen Bradley, Siemens, Modbus, OPC and OPC UA servers, .NET applications, and Universal Driver Interfaces running locally or remote.
When to use buffered data logging
- Desired logging frequency is faster than communication rate to PLC or controller
- Communication to the PLC or controller is intermittent
This guide will focus logging 3 values with 3 data arrays and 1 timestamp array.
The following simulation program will help easily simulate a controller data processing with the following application.
It is not to be used in for your final operation of logging buffered from a controller. It will help automated the tag setup and simulate data coming from a controller.
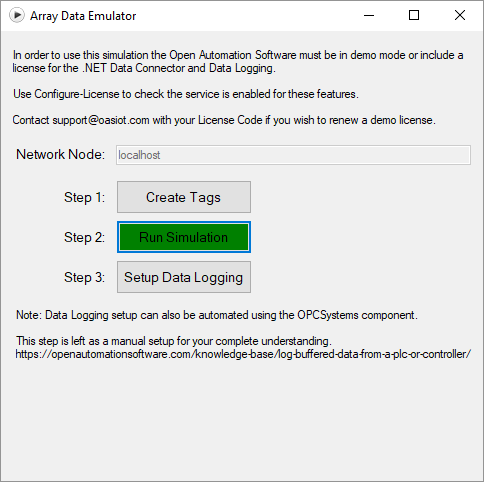
Array Data Emulator – Simulation of logging buffered data from a controller.
Download Array Data Emulator Sample Code
Note: The Array Data Emulator program you will need a license of the .NET Data Connector and Data Logging for an additional 4,007 Tags or in Demo Mode. If you need to test this feature on a production license and do not have these products contact our support team at support@oasiot.com.
You only need a Data Logging license and a Driver if using a controller as a data source.
Step 1
Create Handshaking Logic in Controller
In the controller or PLC define the following variables if they do not already exist. These variables and logic are simulated in the Array Data Emulator program.
Note: You can skip this step if you are using the Array Data Emulator in your first trial of buffered logging.
- Values: Arrays containing queued values to be logged. The data type of the array can be anything you desire including Double Float, Single Float, Long Integer, Integer, Short Integer, Boolean, or Strings.
- Timestamp: Optionally specify a String array containing queued timestamps for each sample in the value arrays. The values in each element would either be a date value or a string that would represent a date including milliseconds if desired.
- Ready: Boolean variable that controller will set to true when the array values are all loaded and ready.
- Confirmation: Boolean variable that will receive a confirmation that the values in the data array are received to be logged. When this value is set to true the controller will set this variable back to false, reset the array of values, and fill the array of the next set of data to be logged.
- Error: Integer variable that will be set to an error code if there is a problem with the logging of data values.
- Timeout: Internal time period the controller will wait for either the Confirmation bit or Error Integer after the Ready bit is set to true. If the time elapses without either Confirmation or Error after the Ready is set the controller will abort the logging and not reset the array and try the sequence again and post an error to the operator that logging has halted.
Create the following logic routines in the controller if they do not already exist.
- Fill the Values array with the sequential values to be logged.
- Set the Error integer to 0.
- Set the Confirmation bit to false.
- Set the Ready bit to true.
- If the Confirmation feedback bit goes to true.
- Clear the Values array.
- Return back to the first step
- If the Error feedback integer goes to non zero.
- Inform operations that logging has halted.
- Return back to the first step
- If the Confirmation bit or Error integer are never received within the timeout period.
- Inform operations that logging has halted.
- Return back to the first step
Step 2
Create Tags
If testing without a controller run the ArrayDataEmulator.exe application from the bin/Release directory.
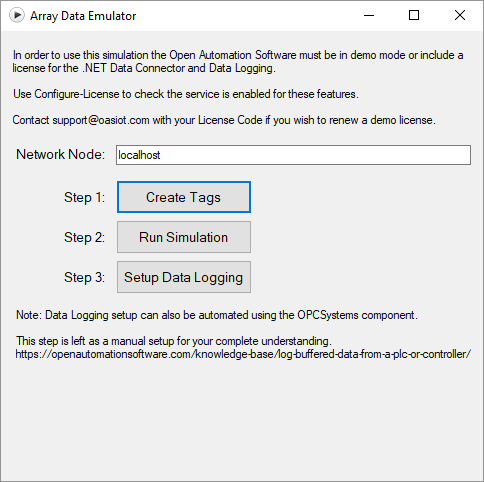
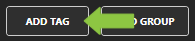
Click on the Create Tags button.
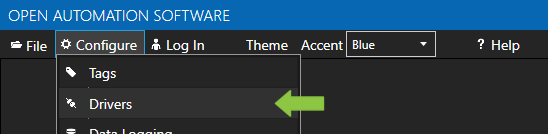
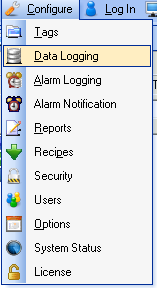
Run the Configure OAS application.
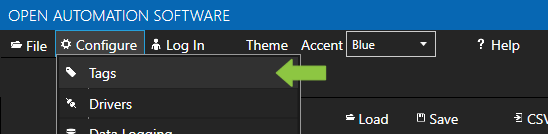
Select Configure-Tags and click on the Select button to the right of Network Node.
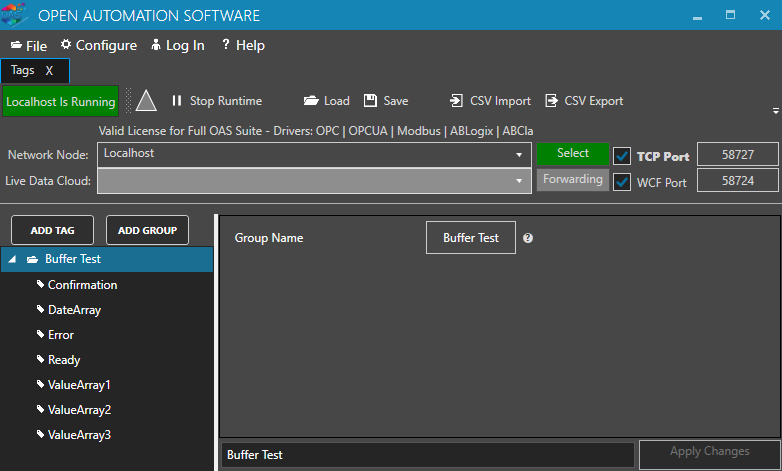
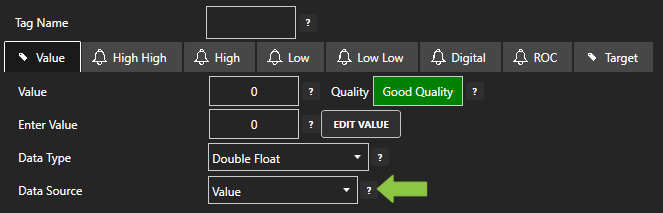
There you will see the Tags created by the Array Data Emulator program automatically which will be the same type of tags you can reuse or add manually for the controller communications. The Data Source is just set a Value for this emulation where you would set the Data Source to your controller’s communication driver.
- Confirmation
Data Type: Boolean
- DateArray
Data Type: Array String
- Error
Data Type: Integer
- Ready
Data Type: Boolean
- ValueArray1
Data Type: Double
- ValueArray2
Data Type: Double
- ValueArray3
Data Type: Double
Step 3
Setup Data Logging
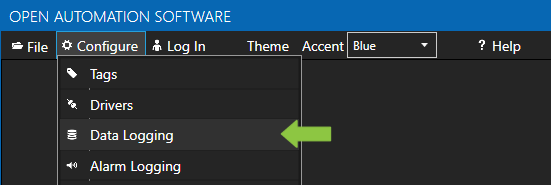
From the Configure OAS application select Configure-Data Logging and click on the Select button next to the network node field.
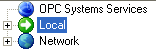
Select the Local OAS Service by selecting the Select button or the Local node in the service tree to the left.

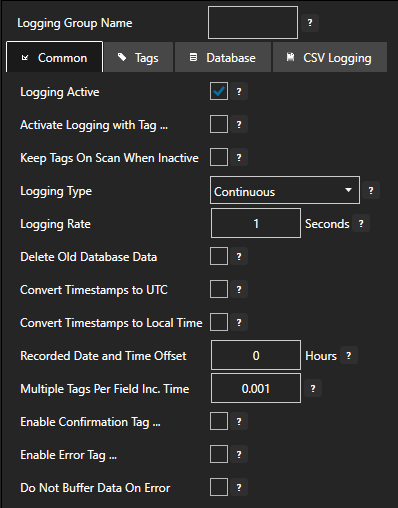
Enter the Logging Group Name of Test in the field in the upper right.
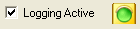
Check Logging Active in the Common Properties Tab.
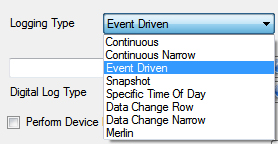
Set the Logging Type to Event Driven.
Use the Browse button to set the Trigger Tag to “Buffer Test.Ready.Value”
Set the Confirmation Tag to “Buffer Test.Confirmation.Value”
Set the Error Tag to “Buffer Test.Error.Value”
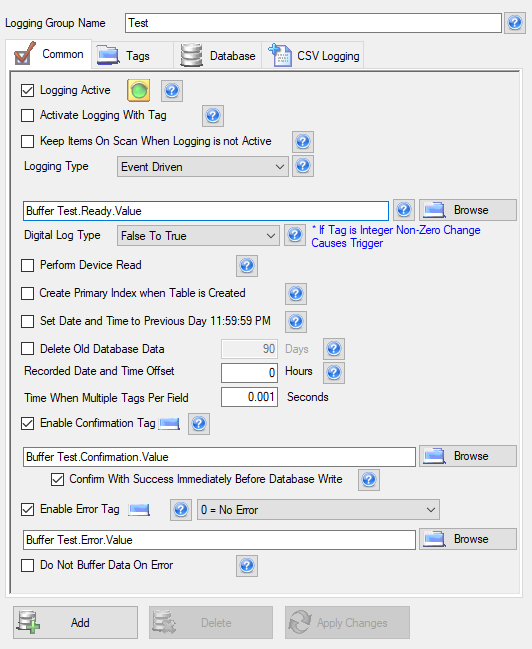
Note: For the fastest transaction processing enable the property “Confirm With Success Immediately Before Database Write”. This will send the confirmation back to the controller before logging the values to the database. You can rely on the Data Buffer feature under Configure-Options to buffer the records to disk if there is a database engine error.
Step 4
Define Date and Time to Log
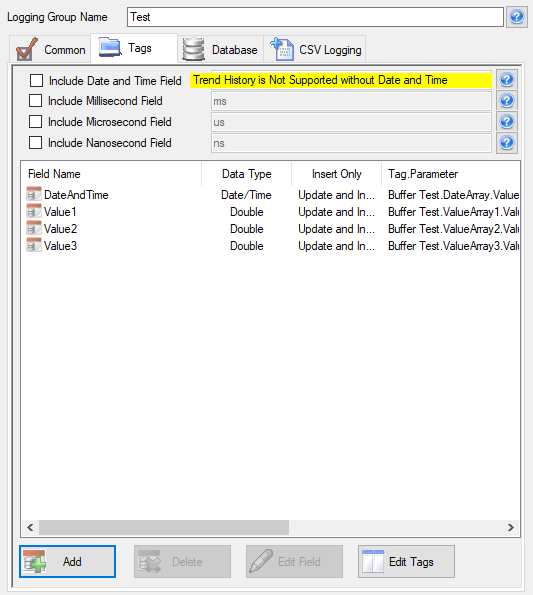
Select the Tags tab in the logging group.
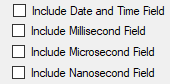
Uncheck the property to Include Date and Time Field.
Note: If you want to include timestamps for your date the time should come from the controller. All OAS Data Sources receive the timestamp with the value source, but in this Event Logging time the Date and Time come from the Trigger Tag value, not the array values in the controller.
Select the Add Field button.
If you want to log timestamps with your values select the Tag Parameter Buffer Test.DateArray.Value.
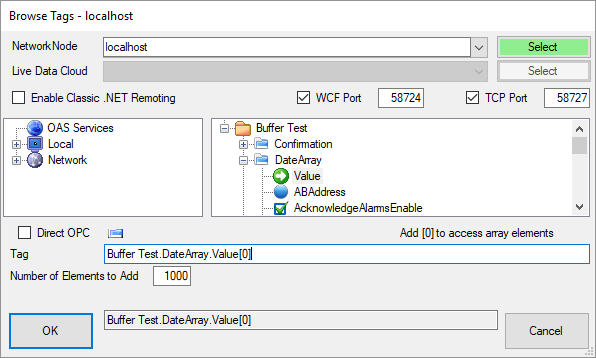
Add [0] to the end of the tag name to log the first element and specify the number of elements to add, the same size of the array in the controller. If using the Array Data Emulator simulation enter 1000 as the Number of Elements to Add.
Click OK
Change the field name in the next dialog to DateAndTime or to the database column name you desire for the timestamps.
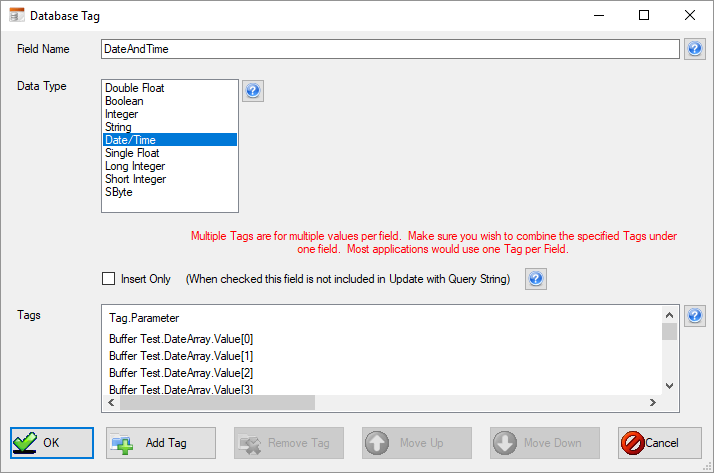
Note: If each individual sample needs to be accessed as individual tags you can use the Add Tag button to add additional tags.
Change the Data Type to Date/Time.
Click OK
Step 5
Define Values to Log
Select the Add Field button again to select the data arrays.
Select the Tag Parameter Buffer Test.ValuesArray1.Value.
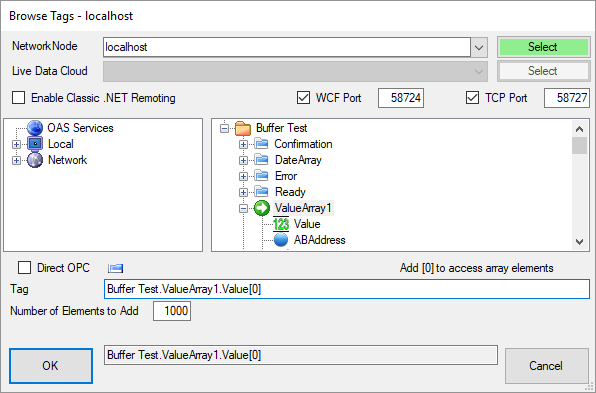
Add [0] to the end of the tag name and specify the number of elements to add, the same size of the array in the controller or 1000 if using the Array Data Emulator.
Click OK
Change the field name in the next dialog to Value1 or to the database column name you desire for this array.
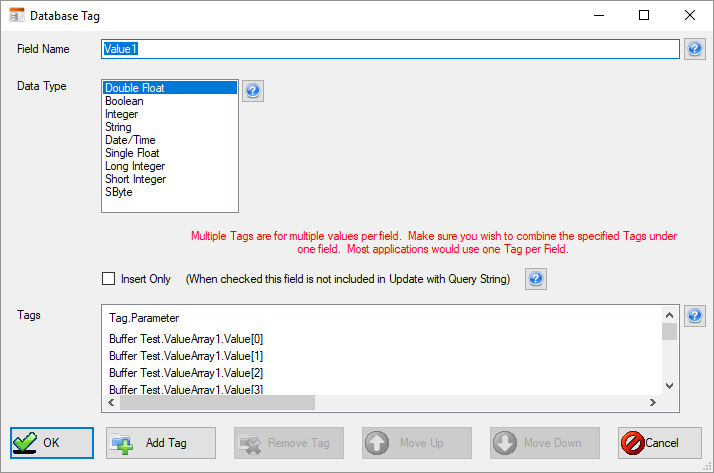
Note: If each individual sample needs to be accessed as individual tags you can use the Add Tag button to add additional tags.
Click OK
Repeat Step 5 for Value2 and Value3 or as many additional fields you wish to add. All should have the same array size by setting the Number of Elements to Add the same.
Step 6
Specify Database Table or CSV File
Select the Database tab of CSV Logging tab to define where the data will be logged. In this example we will log the data to SQL Server.
Logging to SQL Server or SQL Server Express
Use the following configuration for SQL Server. The Database and Table will automatically be created for you.
Note: You can download a free version of SQL Server Express from https://www.microsoft.com/en-us/sql-server/sql-server-editions-express.
When installing SQL Server Express also select the option at the end to install SSMS (SQL Server Management Studio) which you can use to set security Logins and to view the data that is being logged.
Check Log To Database
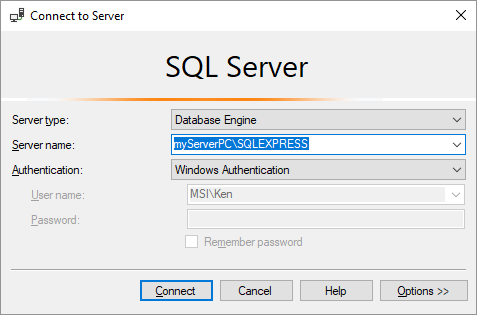
The Server name may need to be adjusted from localhost to the proper Server name of the SQL Server engine you wish to log to. This Server name can be found when first bringing up the Connect dialog of the SQL Server Management Studio.
Also the login method can be with Windows Authentication or SQL Server mode. Contact your database administrator if you are unsure of what login type to use.
Set the Database name to OASSimulation
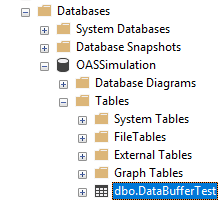
Set the Table name to DataBufferTest
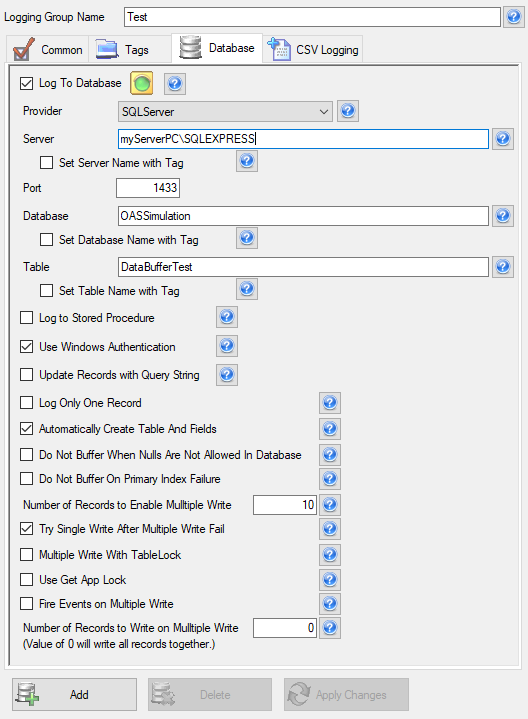
Click the Add button at the bottom to add the data logging group to the OAS service.
Logging to Microsoft Azure
Use the SQL Server Provider and view the following guide to setup Microsoft Azure:
/knowledge-base/windows-azure-setup/
Logging to Oracle
If you are using Oracle you must first create the database. All other steps are the same as SQL Server except the provider should be set to Oracle. Oracle does not create the database so you will have create the database manually.
If you do not have a TNSNAMES.ORA file or need to log to a remote database engine refer to the Frequently Asked Questions in this Data Logging topic.
Logging to mySQL, MariaDB, SQLite, MongoDB, PostgreSQL
All steps are the same as using SQL Server except the provider should be set to you desired provider.
Logging to Cassandra
Cassandra requires a primary key on the Date and Time and event logging without the Date and Time included is not permitted.
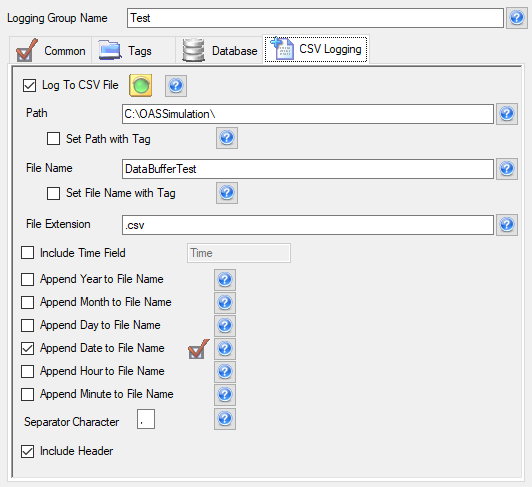
Logging to Comma Separated Variable Files
Use the following configuration for CSV text logging.
Make sure to create the directory OASSimulation on your C drive or specify a different file path that will exist.
Step 7
Activate Controller Logic or Data Emulator
After completing the above steps you can enable your controller logic or click on view the data in your database or CSV file.
If running the Array Data Emulator select Run Simulation.
The data is now ready to be viewed in your destination.
If logging to SQL Server use the SQL Server Management studio to view the contents of the table DataBufferTest under the OASSimulation database.
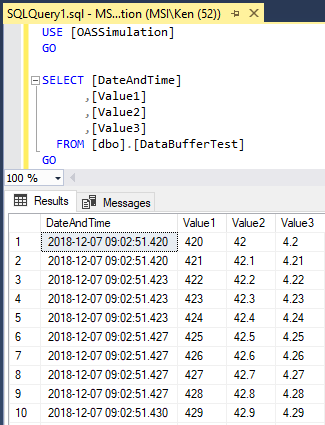
Here you will see all of the records at the sample rate you desire with continuous data from the date and time and values. Using the Array Data Emulator the sample rate is 1 millisecond. It can be even faster if your controller has a cycle time or can process sensor data and queue it into an array at a faster rate.
The source code of the Array Data Emulator is provided in the download so you can testing logging at a faster rate or change the size of the arrays to log.
Step 8
Save Configuration for Loading
Select the Save button on the toolbar at the top under Configure-Data Logging to save a file.
Select the Save button on the toolbar at the top under Configure-Tags to save a save the tag configuration file.
Go to Configure-Options and set the default Tag and Data Logging Configuration files you just saved.
Step 9
Data Buffer to Disk on Database Engine or CSV File Lock
Important: Enable Data Buffer To Disk under Configure-Options-Data Buffering on all data source Tag servers and data logging servers to retain data on a network failure, database engine failure, or if Excel has a CSV file open as it locks it for exclusive use.
Without this property enabled data buffering on failure will use up RAM of the operating system.
For more detailed information on each data logging parameter view the Data Logging section of this Knowledge Base.