Using the .NET Standard 2.0 specification, and .NET Core, you can build communications drivers for OAS that run on Windows, Linux, Mac, Android, and iOS. You can even deploy a driver to run on a Raspberry Pi running the Raspbian OS. Read more about UDI Platform Support for specific OS versions and requirements.
Universal Driver Interface Overview
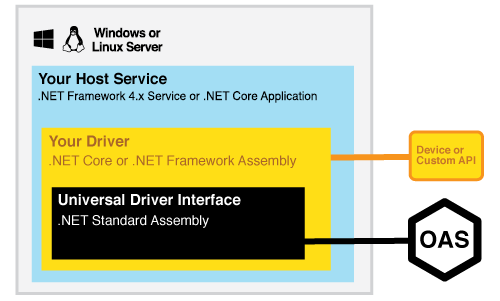
The Universal Driver Interface opens up endless possibilities for connecting the OAS Platform with any data source, device, or external API, as well as operating on Windows, Mac, Linux, Android and iOS platforms.
More:
UDI Technical Overview
The Universal Driver Interface is built upon the .NET Standard 2.0 Framework, allowing it to be deployed and run on Windows, Mac, Linux, Android, iOS, and even Raspberry Pi* platforms. This opens up unlimited integration scenarios for the OAS Platform, allowing for new edge computing solutions and device connectivity.
OAS Platform Native Drivers
The OAS Platform ships with built-in native drivers for many devices such as Allen Bradley, Siemens, and Modbus PLCs. Connectivity can be configured using the OAS Configuration tool, exposing real time data and control to the Platform. Once connected, each device’s data can be shared over any network between other installations of the OAS Platform, providing a great deal of flexibility in deployment and data aggregation.
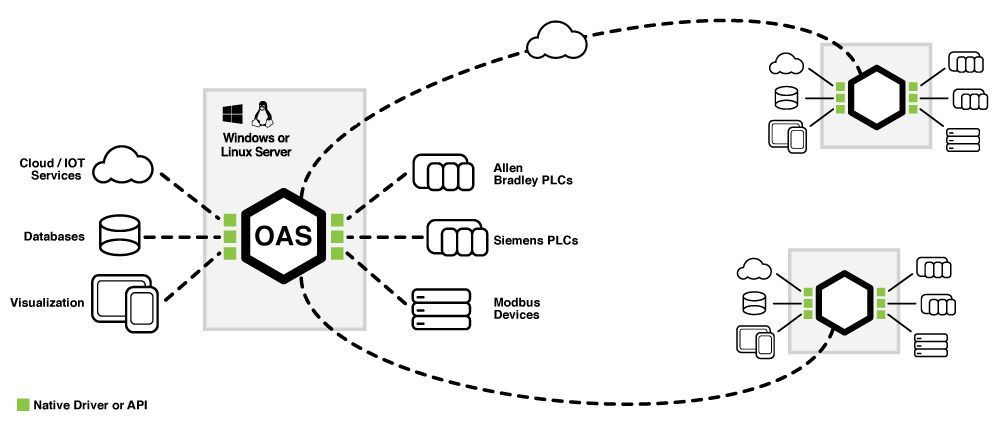
OAS Universal Driver (UDI)
The UDI SDK allows developers create new and customized integrations that may not be possible with the built-in device drivers. Using the SDK, a developer writes custom code to read and write data against any external API or protocol, exposing these data points to an OAS Server. The UDI implementation is written in either C# or VB.NET against the .NET Core 2.0 Framework, and depending on the desired deployment target, can be deployed as a Windows Service or application to be run on any other supported platform.
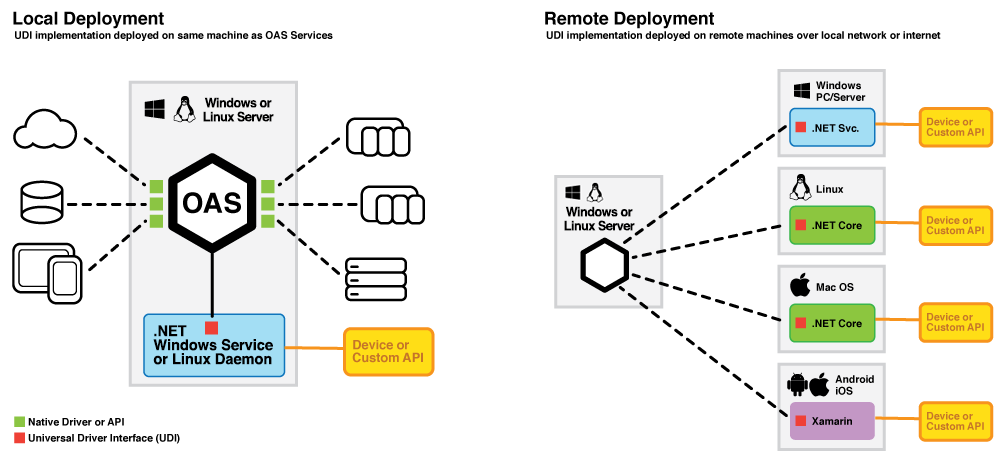
Additionally, the UDI implementation can be deployed either on the same machine as the OAS Server if written as a Windows Service, or it can be deployed remotely on another Windows PC or server. If the UDI implementation is written as a .NET Core application, it can be deployed as a Mac or Linux application and installed as a persistent background process. If desired, a UDI implementation can also be written using Xamarin and deployed as an Android or iOS application.
UDI Application Architecture
The .NET Standard is a cross-platform, baseline version of the .NET libraries. The UDI is built to support the .NET Standard 2.0, allowing for device drivers to be written for any platform supported by the .NET Standard.
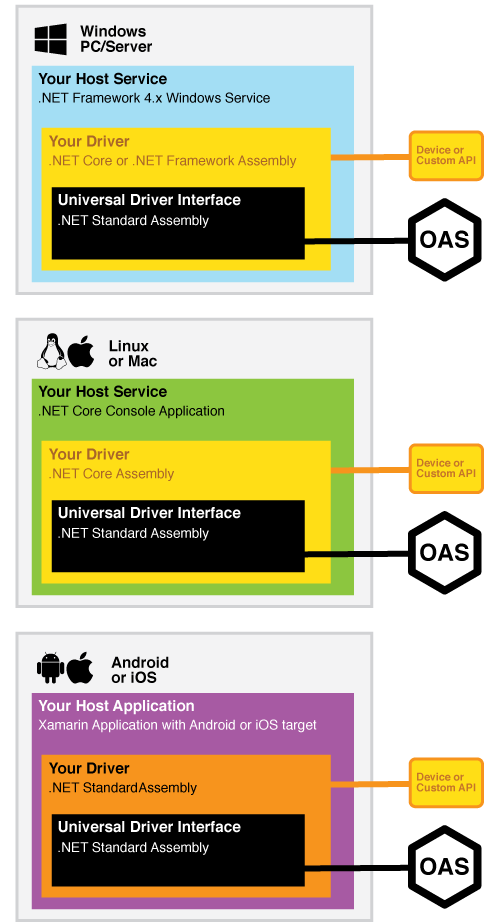 Developing Your Driver as a .NET Core or .NET Standard Assembly will allow for the interface to be reused on multiple platforms without the core code being recompiled. A “wrapper” application or service can use the assembly with each deployment target and use case having it’s own custom wrapper. This can be a Windows Service, a console application, or even mobile app.
*While Raspbery Pi is not technically supported as a deployment platform by MS, the Raspbian OS is a variant of Debian, which is a supported target.
UDI Platform Support
The Universal Driver Interface can be deployed on any platform supported by .NET Standard, .NET Core, and .NET Framework. This includes Windows, Mac OS X, many variants of Linux, and even mobile platforms such as Android and iOS. Below are the details on each platform and minimum compatibility requirements.
 Windows
| OS | Versions | Architectures |
| Windows Client | 7 SP1+, 8.1 | X64, x86 |
| Windows 10 Client | Version 1607+ | X64, x86 |
| Windows Server | 2008 R2 SP1+ | X64, x86 |
 Mac OS
| OS | Versions | Architectures |
| Mac OS X | 10.12+ | X64 |
 Linux
Linux
| OS | Versions | Architectures |
| Red Hat Enterprise | 7, 6 | x64 |
| CentOS | 7 | x64 |
| Oracle Linux | 7 | x64 |
| Fedora | 27 | x64 |
| Debian | 9, 8.7+ | x64 |
| Ubuntu | 18.04, 16.04, 14.04 | x64 |
| Linux Mint | 18, 17 | x64 |
| openSUSE | 42.3+ | x64 |
| SUSE Enterprise Linux (SLES) | 12 SP2+ | x64 |
 Android, iOS, Mac through Xamarin
| Xamarin Target | Minimum Version |
| Xamarin.iOS | 10.14 |
| Xamarin.Mac | 3.8 |
| Xamarin.Android | 8.0 |
 Unofficially Supported
| OS | Versions | Hardware |
| Raspbian (Debian-based Linux) |
Kernel 3.18+ | Raspberry Pi 3, 3+ recommended for minimum performance |
Create Universal Driver Interface
The first step in creating a custom communication driver for OAS is to create the Driver Assembly. This .NET Assembly will be referenced by a .NET Hosting Application, and depending on the target deployment platforms, can be developed to be cross-platform compatible for use on Windows, Mac, Linux, Android, and iOS operating systems.
Assembly Installation
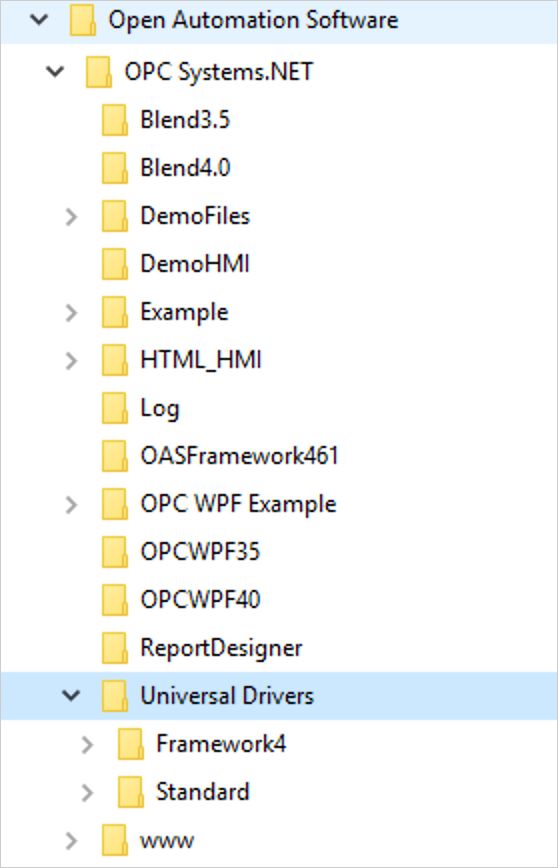
- All OAS .NET Assemblies are distributed with the OAS Platform and located within the installation directory
- Optionally, you can install the assembly package from NuGet within Visual Studio
Direct link to the OASIOT.OASData package: https://www.nuget.org/packages/OASIOT.OASDriverInterface
Choosing a Framework
 If you would like the flexibility of being able to run your driver on multiple operating systems, your driver should target the .NET Standard 2.0+ framework. Yet, we understand that in some cases you must rely on other 3rd party libraries that are not compatible, or you cannot upgrade your infrastructure to the NET Framework 4.6.1+. In these cases, your driver must target the .NET 4.0 Framework, and will be limited to being run on a Windows platform.
In the OAS Platform distribution, we have provided Examples for any of these scenarios. In the installation directory, locate the Universal Drivers folder, to find all Example code for drivers and Hosting Apps, in both C# and VB.NET.
For cross-platform support, choose the examples under the Standard directory, and for .NET 4.0 or 4.5 only support, select examples under the Framework4 directory.
The Driver Architecture
Building a functional UDI Driver includes the development of your own Driver assembly following our example code, then running this within a Hosting Application. In this tutorial, we will be building a .NET Framework 4.0 Driver hosted within a Windows Service to be deployed on a Windows Server or PC.
Prerequisites
You will need to be running Open Automation Software Version 11.00.0017 or greater to support Universal Drivers. You can download the latest version at /download/
You will also need Microsoft Visual Studio to work with any of these examples and to compile your custom driver. If you do not currently have Visual Studio installed, you can try out Visual Studio Community which is a fully functional, free version of the IDE.
Step 1
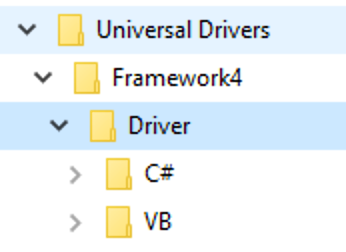 Copy the C# or VB Driver Code from the OAS installation path, typically C:\Program Files\Open Automation Software\OAS\Universal Drivers\Framework4\Driver\ to a location of your choosing, then open the project in Visual Studio.
NOTE: Under the project references, if you are getting a warning or if the OASDriverInterface (or OASDriverInterfaceFramework4 for a .NET Framwework 4.0 Driver project) assembly is missing, remove the reference and add it back in, locating it in the base OAS installation directory.
Step 2
Under the Project Properties set the Assembly name and Root namespace name to something unique for each driver you create. The default is ExampleDriver, so we’ll leave this as is but you should change this to uniquely identify your driver for each data source.
The Assembly Name will be the resulting DLL that is compiled. In this case, the assembly will compile to a file named ExampleDriver.dll.
The Default Namespace will only affect new classes and files added to your driver. You may also search and replace all references of ExampleDriver with your own custom driver name so that it displays properly in all other project references.

Step 3
Open the file DriverInterface.vb for the VB project or DriverInterface.cs for the C# project and set the m_DriverName variable to a unique name for each driver you create.
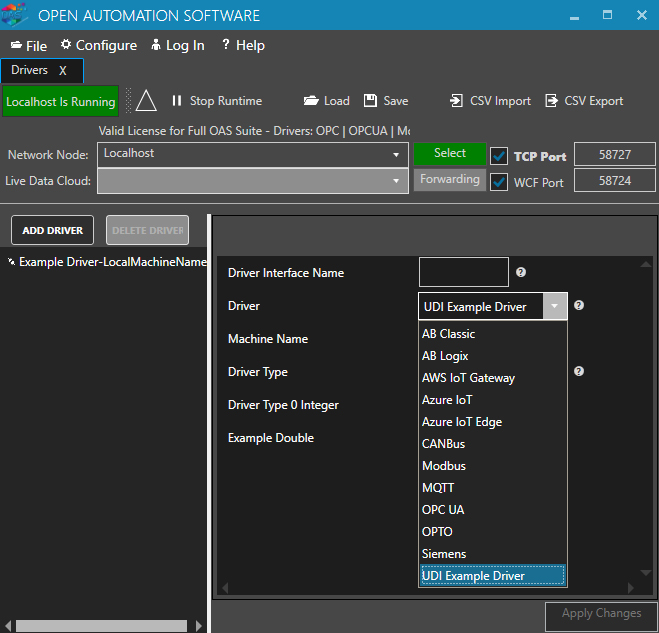
This string is the display name that will appear within the OAS Configuration application. The driver name will display in the following formats.
In the list of Drivers associated with the OAS Server, you will see UDI drivers in the left pane as:
<Driver Name>-<MachineName>
The <Machine Name> will be defined in the host application configuration file (detailed in the Hosting App tutorial), so this can be changed upon deployment and will help with identifying instances of the same drivers hosted on different or remote machines.
In the dropdown lists of drivers, including the dropdowns used to select the data source of a Tag, the UDI Driver will be displayed as:
UDI <Driver Name>
The Driver Name is set within the source code by setting the m_DriverName string.
VB
Private m_DriverName As String = "Example Driver"
C#
private string m_DriverName = "Example Driver";
The example below shows how the driver would be listed in the OAS Configuration app if the m_DriverName string was set to “Example Driver”.
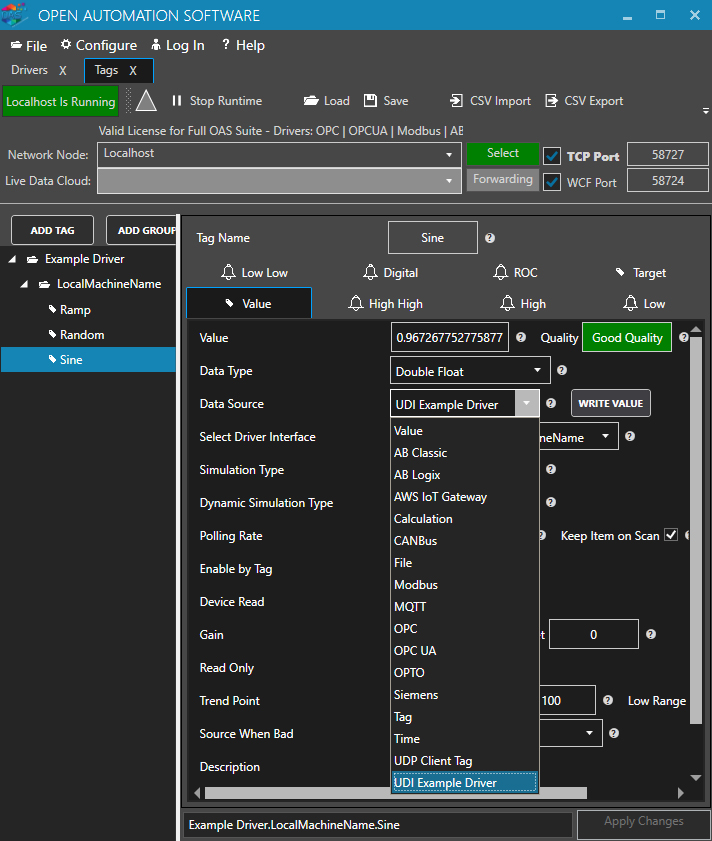
The driver name also becomes an available selection for Data Source in the Tag parameters for Value and Alarm Limits.
Step 4
Define the Driver Interface properties you would like make adjustable in the function GetDefaultDriverConfig with a list of ClassProperty objects.
The collection of DriverProps returned in the GetDefaultDriverConfig defines the list of configurable properties for the driver which will be exposed in the OAS Configuration application.
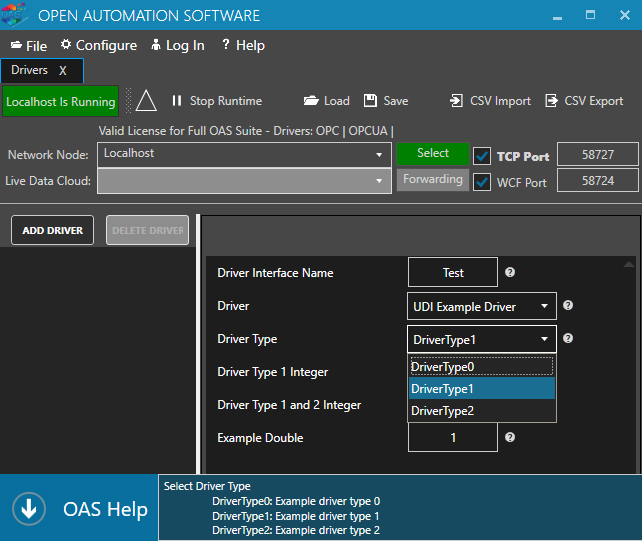
Below is an example that adds several properties, including one called “Driver Type” that selectively triggers other property fields’ visibility depending on the value selected.
Each Driver property is an instance of a ClassProperty that can be one of many different types, including selectable options, input text fields and more.
VB
    Public Overrides Function GetDefaultDriverConfig() As List(Of ClassProperty)
        Try
            Dim DriverProps As New List(Of ClassProperty)
            DriverProps.Clear()
            ' Define the properties for the Interface.  Typically IP Address, Port Number, database connection settings, etc.
            ' Example of an enumerated value
            DriverProps.Add(New ClassProperty("DriverType", "Driver Type", "Select Driver Type
                DriverType0: Example driver type 0
                DriverType1: Example driver type 1
                DriverType2: Example driver type 2", GetType(SelectDriverType), SelectDriverType.DriverType0, ClassProperty.ePropInputType.Manual))
            ' Example of Integer values.
            ' Optionally to each property you can add a Visible property binding to the value of another control.  In this example the DriverType selected will show the appropriate integer value.
            ' The Visible binding can use | for an OR condition or & for AND condition to combine criteria for the property to be visible.
            DriverProps.Add(New ClassProperty("DriverType0Integer", "Driver Type 0 Integer", "Example value for DriverType0", GetType(Int32), 0, ClassProperty.ePropInputType.Manual, "Visible,DriverType.DriverType0"))
            DriverProps.Add(New ClassProperty("DriverType1Integer", "Driver Type 1 Integer", "Example value for DriverType1", GetType(Int32), 1, ClassProperty.ePropInputType.Manual, "Visible,DriverType.DriverType1"))
            DriverProps.Add(New ClassProperty("DriverType1And2Integer", "Driver Type 1 and 2 Integer", "Example value for DriverType1 and DriverType2", GetType(Int32), 2, ClassProperty.ePropInputType.Manual, "Visible,DriverType.DriverType1|DriverType.DriverType2"))
            DriverProps.Add(New ClassProperty("ExampleDouble", "Example Double", "Example value for all types", GetType(Double), 1, ClassProperty.ePropInputType.Manual))
            Return DriverProps
        Catch ex As Exception
            m_OASDriverInterface.UpdateSystemError(True, "Configuration", 1, "GetDefaultDriverConfig Exception: " + ex.Message)
        End Try
    End Function
C#
public override List GetDefaultDriverConfig()
		{
			try
			{
				List DriverProps = new List();
				DriverProps.Clear();
				// Define the properties for the Interface.  Typically IP Address, Port Number, database connection settings, etc.
				// Example of an enumerated value
				DriverProps.Add(new ClassProperty("DriverType", "Driver Type", @"Select Driver Type
                DriverType0: Example driver type 0
                DriverType1: Example driver type 1
                DriverType2: Example driver type 2", typeof(SelectDriverType), SelectDriverType.DriverType0, ClassProperty.ePropInputType.Manual));
				// Example of Integer values.
				// Optionally to each property you can add a Visible property binding to the value of another control.  In this example the DriverType selected will show the appropriate integer value.
				// The Visible binding can use | for an OR condition or & for AND condition to combine criteria for the property to be visible.
				DriverProps.Add(new ClassProperty("DriverType0Integer", "Driver Type 0 Integer", "Example value for DriverType0", typeof(Int32), 0, ClassProperty.ePropInputType.Manual, "Visible,DriverType.DriverType0"));
				DriverProps.Add(new ClassProperty("DriverType1Integer", "Driver Type 1 Integer", "Example value for DriverType1", typeof(Int32), 1, ClassProperty.ePropInputType.Manual, "Visible,DriverType.DriverType1"));
				DriverProps.Add(new ClassProperty("DriverType1And2Integer", "Driver Type 1 and 2 Integer", "Example value for DriverType1 and DriverType2", typeof(Int32), 2, ClassProperty.ePropInputType.Manual, "Visible,DriverType.DriverType1|DriverType.DriverType2"));
				DriverProps.Add(new ClassProperty("ExampleDouble", "Example Double", "Example value for all types", typeof(double), 1, ClassProperty.ePropInputType.Manual));
				return DriverProps;
			}
			catch (Exception ex)
			{
					m_OASDriverInterface.UpdateSystemError(true, "Configuration", 1, "GetDefaultDriverConfig Exception: " + ex.Message);
			}
			return null;
		}
ClassProperty
The ClassProperty object is used to define both Driver Interface and Tag properties that you would like to appear in the OAS Framework for system setup.
Following is a list of the variables passed into the constructor for a ClassProperty object.
    Public Sub New(ByVal newPropName As String,
        ByVal newPropDescription As String,
        ByVal newPropHelp As String,
        ByVal newPropType As Type,
        ByVal newPropValue As Object,
        ByVal newPropInputType As ePropInputType,
        Optional ByVal newBinding As String = "",
        Optional ByVal newUnits As String = "")
    End Sub
- PropName
A unique name that identifies the property. This will the be name used for CSV Import and Export and also for programmatic setup with the TagCSVImport and DriverInterfaceCSVImport methods. - PropDescription
The text that will appear next to the property in the Configure OAS application. - PropHelp
The text that will appear in the help window for this property in the Configure OAS application. If left blank the help icon will not appear next to the property. - PropType
The data type of the property value. You can define enumerations or common data types. - PropValue
This will be the default value of the property when a Driver Interface or Tag is created. - InputType
This is the configuration input type to use for the property. Manual is the most commonly used input type, but there are also FileBrowse and other configuration input types that can be used to define a value in the Configure OAS application. - Binding
This is an optional property that can be used to control the visibility of property in the Configure OAS application based on the values of other configuration properties. If left blank the property will always appear. - Units
This is an optional property that defines the text that will appear after the property value. If left blank the text will not appear.
Example of what will appear in Configure-Drivers with this example code:
Step 5
Add code to the Connect method to be executed when the driver instance enters runtime mode.
This method is where you would do one or more of the following:
- Execute initialization code for connecting to your data source
- Read driver configuration properties for initialization using the GetPropValue function
- Set up timers to trigger polling activities
In this example, we read some of the persisted properties for the driver as it was configured. Then we check a flag (m_Connected) to determine if the driver has already executed Connect, and if not, start a local Timer to begin triggering.
VB
    Public Overrides Sub Connect()
        Try
            'Add Connection Logic. m_DriverProps is a list of ClassDriverProperty in the same order of Get Driver Config
            Dim DriverType As SelectDriverType = GetPropValue(m_DriverProps, "DriverType")
            Dim DriverType0Integer As Int32 = GetPropValue(m_DriverProps, "DriverType0Integer")
            Dim DriverType1Integer As Int32 = GetPropValue(m_DriverProps, "DriverType1Integer")
            Dim DriverType2Integer As Int32 = GetPropValue(m_DriverProps, "DriverType1And2Integer")
            Dim ExampleDouble As Double = GetPropValue(m_DriverProps, "ExampleDouble")
            If Not (m_Connected) Then
                localTimer.Change(100, 100)
            End If
            m_Connected = True
        Catch ex As Exception
            m_OASDriverInterface.UpdateSystemError(True, "Connect", 1, "GetDefaultDriverConfig Exception: " + ex.Message)
        End Try
    End Sub
C#
public override void Connect() {
  try {
    //Add Connection Logic. m_DriverProps is a list of ClassDriverProperty in the same order of Get Driver Config
    SelectDriverType DriverType = (MyExampleOASDriver.DriverInterface.SelectDriverType)GetPropValue(m_DriverProps, "DriverType");
    int DriverType0Integer = Convert.ToInt32(GetPropValue(m_DriverProps, "DriverType0Integer"));
    int DriverType1Integer = Convert.ToInt32(GetPropValue(m_DriverProps, "DriverType1Integer"));
    int DriverType2Integer = Convert.ToInt32(GetPropValue(m_DriverProps, "DriverType1And2Integer"));
    double ExampleDouble = Convert.ToDouble(GetPropValue(m_DriverProps, "ExampleDouble"));
    if (!(m_Connected))
    {
      localTimer.Change(100, 100);
    }
    m_Connected = true;
  }
  catch (Exception ex) {
      m_OASDriverInterface.UpdateSystemError(true, "Connect", 1, "GetDefaultDriverConfig Exception: " + ex.Message);
  }
}
Step 6
Add code to the Disconnect method to be executed when the driver instance exits runtime mode. This should be used to shut down any connections and undo any initialization that was performed during the Connect method.
In this example, we set the m_Connected flag to false, stop the local Timer, and clear out any tag data using the m_Tags.Clear method.
VB
    Public Overrides Function Disconnect() As Boolean
        Try
            If Not (m_Connected) Then
                Return m_Connected
            End If

            'Add Disconnection Logic
            localTimer.Change(Timeout.Infinite, Timeout.Infinite)

            SyncLock m_Tags.SyncRoot
                m_Tags.Clear()
            End SyncLock

            m_Connected = False
            Return m_Connected
        Catch ex As Exception
            m_OASDriverInterface.UpdateSystemError(True, "Disconnect", 1, "GetDefaultDriverConfig Exception: " + ex.Message)
        End Try
    End Function
C#
public override bool Disconnect() {
  try {
    if (!(m_Connected)) {
      return m_Connected;
    }

    //Add Disconnection Logic
    localTimer.Change(Timeout.Infinite, Timeout.Infinite);

    lock (m_Tags.SyncRoot) {
      m_Tags.Clear();
    }

    m_Connected = false;
    return m_Connected;
  }
  catch (Exception ex)
  {
      m_OASDriverInterface.UpdateSystemError(true, "Disconnect", 1, "GetDefaultDriverConfig Exception: " + ex.Message);
  }
  return false;
}
Step 7
Define the Tag properties you would like make adjustable in the function GetDefaultTagConfig with a list of ClassProperty objects.
These are properties that will be displayed and associated with a Tag configuration when the tag source uses your Driver. These properties will be added to the Value tab in the OAS Configuration app.
These properties are also defined using the ClassProperty object and added to the m_TagProps collection.
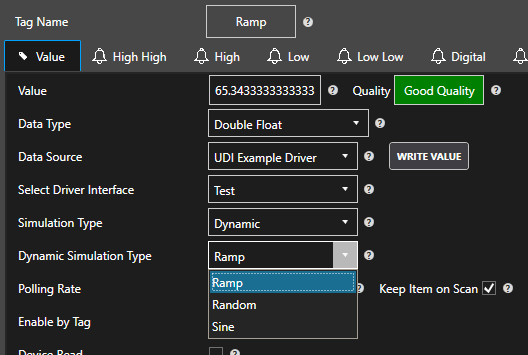
In this example, we are adding two Tag properties for Simulation Type and Dynamic Simulation Type.
VB
    Public Overrides Function GetDefaultTagConfig() As List(Of ClassProperty)
        Try
            Dim m_TagProps As New List(Of ClassProperty)

            m_TagProps.Add(New ClassProperty("SimType",
                "Simulation Type",
                "The simulation type of a Parameter can be set to one of the following types.
                    Dynamic: Read only value that changes dynamically from one of the Dynamic Simuation Types
                    Static: Value is fixed and can be written to.",
                GetType(SimTypes),
                SimTypes.Dynamic,
                ClassProperty.ePropInputType.Manual))

            m_TagProps.Add(New ClassProperty("DynamicSimType",
                "Dynamic Simulation Type",
                "The dynamic simulation type of a Parameter can be set to one of the following types.
                    Ramp: Value changes from 0 to 100.
                    Random: Value changes randomly from 0 to 100
                    Sine: Value changes from -1 to 1",
                GetType(DynamicSimTypes),
                DynamicSimTypes.Ramp,
                ClassProperty.ePropInputType.Manual,
                "Visible,SimType.Dynamic"))

            Return m_TagProps
        Catch ex As Exception
            m_OASDriverInterface.UpdateSystemError(True, "Configuration", 1, "GetDefaultTagConfig Exception: " + ex.Message)
        End Try
    End Function
C#
public override List GetDefaultTagConfig() {
  try {
    List m_TagProps = new List();

    m_TagProps.Add(new ClassProperty("SimType",
                          "Simulation Type",
                          @"The simulation type of a Parameter can be set to one of the following types.
                              Dynamic: Read only value that changes dynamically from one of the Dynamic Simuation Types
                              Static: Value is fixed and can be written to.",
                          typeof(SimTypes),
                          SimTypes.Dynamic,
                          ClassProperty.ePropInputType.Manual));

    m_TagProps.Add(new ClassProperty("DynamicSimType",
                          "Dynamic Simulation Type",
                          @"The dynamic simulation type of a Parameter can be set to one of the following types.
                              Ramp: Value changes from 0 to 100.
                              Random: Value changes randomly from 0 to 100
                              Sine: Value changes from -1 to 1",
                          typeof(DynamicSimTypes),
                          DynamicSimTypes.Ramp,
                          ClassProperty.ePropInputType.Manual,
                          "Visible,SimType.Dynamic"));

    return m_TagProps;
  }
  catch (Exception ex) {
        m_OASDriverInterface.UpdateSystemError(true, "Configuration", 1, "GetDefaultTagConfig Exception: " + ex.Message);
    }
    return null;
  }
}
Example of what will appear in Configure-Tags with this example code:
Step 8
Add code to the AddTags method that passes the tags to be monitored with continuous polling.
All Tag Properties defined in the driver will be available at this point and additionally TagName and PollingRate and can be inspected using the GetPropValue method.
This example demonstrates pulling the TagName, and PollingRate. To add a Tag to the continuous polling routines, the tag is then added to the m_Tags collection. We further reset the timestamp stored in the m_LastUpdateTime for the Tag which is used to track the last time the Tag value has been updated.
    Public Overrides Sub AddTags(ByVal Tags() As List(Of ClassProperty))
        Try
            'Add Logic. Props is a list of ClassProperty in the same order of Get Tag Config
            Dim Props As List(Of ClassProperty)
            SyncLock m_Tags.SyncRoot
                For Each Props In Tags
                    ' Use the TagName as a unique identifier for the Tag Name and Parameter being interfaced with.
                    Dim TagID As String = GetPropValue(Props, "TagName")
                    ' Use the polling rate to set the communication rate to your device or software application.
                    ' If you interface uses async callbacks with a subscription rate you could create multple collections of tags based on PollingRate.
                    Dim PollingRate As Double = GetPropValue(Props, "PollingRate")

                    If m_Tags.Contains(TagID) Then
                        m_Tags(TagID) = Props
                    Else
                        m_Tags.Add(TagID, Props)
                    End If
                    If m_LastUpdateTime.Contains(TagID) Then
                        m_LastUpdateTime.Remove(TagID)
                    End If
                Next
            End SyncLock
        Catch ex As Exception
            m_OASDriverInterface.UpdateSystemError(True, "Communications", 1, "AddTags Exception: " + ex.Message)
        End Try
    End Sub
C#
public override void AddTags(List[] Tags) {
  try
  {
    //Add Logic. Props is a list of ClassProperty in the same order of Get Tag Config
    lock (m_Tags.SyncRoot)
    {
      foreach (List Props in Tags)
      {
        // Use the TagName as a unique identifier for the Tag Name and Parameter being interfaced with.
        string TagID = Convert.ToString(GetPropValue(Props, "TagName"));
        // Use the polling rate to set the communication rate to your device or software application.
        // If you interface uses async callbacks with a subscription rate you could create multiple collections of tags based on PollingRate.
        double PollingRate = Convert.ToDouble(GetPropValue(Props, "PollingRate"));

        if (m_Tags.Contains(TagID))
        {
          m_Tags[TagID] = Props;
        }
        else
        {
          m_Tags.Add(TagID, Props);
        }
        if (m_LastUpdateTime.Contains(TagID))
        {
          m_LastUpdateTime.Remove(TagID);
        }
      }
    }
  }
  catch (Exception ex)
  {
      m_OASDriverInterface.UpdateSystemError(true, "Communications", 1, "AddTags Exception: " + ex.Message);
  }
}
Step 9
Add code to the RemoveTags method that passes the tags to be removed from continuous polling. This should reverse the code added to the AddTags method by removing tags from continuous polling.
This example demonstrates the removal of all Tags from the m_Tags collection and clears out the associated timestamps from the m_LastUpdateTime collection.
    Public Overrides Sub RemoveTags(ByVal Tags() As String)
        Try
            Dim TagID As String
            SyncLock m_Tags.SyncRoot
                For Each TagID In Tags
                    If m_Tags.Contains(TagID) Then
                        m_Tags.Remove(TagID)
                    End If
                    If m_LastUpdateTime.Contains(TagID) Then
                        m_LastUpdateTime.Remove(TagID)
                    End If
                Next
            End SyncLock
        Catch ex As Exception
            m_OASDriverInterface.UpdateSystemError(True, "Communications", 2, "RemoveTags Exception: " + ex.Message)
        End Try
    End Sub
C#
public override void RemoveTags(string[] Tags) {
  try {
    lock (m_Tags.SyncRoot) {
      foreach (string TagID in Tags) {
        if (m_Tags.Contains(TagID)) {
          m_Tags.Remove(TagID);
        }
        if (m_LastUpdateTime.Contains(TagID)) {
          m_LastUpdateTime.Remove(TagID);
        }
      }
    }
  }
  catch (Exception ex) {
      m_OASDriverInterface.UpdateSystemError(true, "Communications", 2, "RemoveTags Exception: " + ex.Message);
  }
}
Step 10
Optionally, you can have your custom Driver create and configure Tags on the server in which it is installed by implementing the GetTagsToAdd method. This example demonstrates adding tags to the configuration so that data will begin flowing as soon as the Driver is activated.
As you can see, we are also using the ClassProperty to define all of the Tags’ configuration properties and even ensure that they connect using the custom Driver as a source. However, you can configure any other Tags that you choose, truly making the deployment of a Driver a hands-off operation.
VB
Public Function GetTagsToAdd() As List(Of List(Of ClassProperty))
    Try
        Dim m_Tags As List(Of List(Of ClassProperty)) = New List(Of List(Of ClassProperty))()
        Dim DynamicSimTypesToAdd As String() = {"Ramp", "Random", "Sine"}
        Dim DynamicSimTypeToAdd As DynamicSimTypes = 0

        For Each DynamicSimTypeString As String In DynamicSimTypesToAdd
            Dim m_TagProps As List(Of ClassProperty) = New List(Of ClassProperty)()
            m_TagProps.Add(New ClassProperty("Tag", "", "", GetType(String), m_DriverName & "." + m_MachineName & "." & DynamicSimTypeString, ClassProperty.ePropInputType.Manual))
            m_TagProps.Add(New ClassProperty("Value - Data Type", "", "", GetType(String), "Double", ClassProperty.ePropInputType.Manual))
            m_TagProps.Add(New ClassProperty("Value - Source", "", "", GetType(String), "UDI " & m_DriverName, ClassProperty.ePropInputType.Manual))
            m_TagProps.Add(New ClassProperty("Value - Driver Interface", "", "", GetType(String), m_DriverName & "-" + m_MachineName, ClassProperty.ePropInputType.Manual))
            m_TagProps.Add(New ClassProperty("Value - UDI " & m_DriverName & " SimType", "", "", GetType(SimTypes), SimTypes.Dynamic, ClassProperty.ePropInputType.Manual))

            Select Case DynamicSimTypeString
                Case "Ramp"
                    DynamicSimTypeToAdd = DynamicSimTypes.Ramp
                Case "Random"
                    DynamicSimTypeToAdd = DynamicSimTypes.Random
                Case "Sine"
                    DynamicSimTypeToAdd = DynamicSimTypes.Sine
            End Select

            m_TagProps.Add(New ClassProperty("Value - UDI " & m_DriverName & " DynamicSimType", "", "", GetType(DynamicSimTypes), DynamicSimTypeToAdd, ClassProperty.ePropInputType.Manual))
            m_Tags.Add(m_TagProps)
        Next

        Return m_Tags
    Catch ex As Exception
        m_OASDriverInterface.UpdateSystemError(True, "Configuration", 4, "GetTagsToAdd Exception: " & ex.Message)
        Return Nothing
    End Try
End Function
C#
public List<List> GetTagsToAdd() {
  try {
    List<List> m_Tags = new List<List>();
    string[] DynamicSimTypesToAdd = {"Ramp", "Random", "Sine"};
    DynamicSimTypes DynamicSimTypeToAdd = 0;

    foreach (string DynamicSimTypeString in DynamicSimTypesToAdd) {
      List m_TagProps = new List();
      // The name of the tag to add. Use periods to create tags within groups, each group seperated by a period.
      m_TagProps.Add(new ClassProperty("Tag", "", "", typeof(string), m_DriverName + "." + m_MachineName + "." + DynamicSimTypeString, ClassProperty.ePropInputType.Manual));

      // Include any property values of the Tag to set.  If the Tag already exists these values will be update the existing Tag.
      // Use the same property names as that are set in a Tag CSV Export

      // The Data Type of Tag value
      m_TagProps.Add(new ClassProperty("Value - Data Type", "", "", typeof(string), "Double", ClassProperty.ePropInputType.Manual));
      // The Data Source of Tag value
      m_TagProps.Add(new ClassProperty("Value - Source", "", "", typeof(string), "UDI " + m_DriverName, ClassProperty.ePropInputType.Manual));
      // The Driver Interface of Tag value
      m_TagProps.Add(new ClassProperty("Value - Driver Interface", "", "", typeof(string), m_DriverName + "-" + m_MachineName, ClassProperty.ePropInputType.Manual));

      m_TagProps.Add(new ClassProperty("Value - UDI " + m_DriverName + " SimType", "", "", typeof(SimTypes), SimTypes.Dynamic, ClassProperty.ePropInputType.Manual));

      switch (DynamicSimTypeString) {
        case "Ramp":
          DynamicSimTypeToAdd = DynamicSimTypes.Ramp;
          break;
        case "Random":
          DynamicSimTypeToAdd = DynamicSimTypes.Random;
          break;
        case "Sine":
          DynamicSimTypeToAdd = DynamicSimTypes.Sine;
          break;
      }
      m_TagProps.Add(new ClassProperty("Value - UDI " + m_DriverName + " DynamicSimType", "", "", typeof(DynamicSimTypes), DynamicSimTypeToAdd, ClassProperty.ePropInputType.Manual));
      m_Tags.Add(m_TagProps);
    }
    return m_Tags;
  }
  catch (Exception ex) {
    m_OASDriverInterface.UpdateSystemError(true, "Configuration", 4, "GetTagsToAdd Exception: " + ex.Message);
    return null;
  }
}
Step 11
Optionally add code to the SyncRead method that passes a tags list, each containing properties. This is for one time read of values based on a trigger in OAS for a Device Read. If you do not need support for the Device Read feature this method can be left blank. For continuous monitoring refer to Step 13 with the AsyncReadCallback method.
If you are connecting to a data source or application, this is where you may pull values from an API or memory cache just once on each call made to the method for the Tags requested.
    ' This call is performed when a Device Read is executed in OAS.
    Public Overrides Function SyncRead(ByVal Tags() As List(Of ClassProperty)) As ClassTagValue()
        Try
            Dim currentTime As Date = Now
            Dim localSeconds As Double = currentTime.Second + (currentTime.Millisecond / 1000)
            Dim TagItems As List(Of ClassProperty)

            Dim localArrayList As New ArrayList

            SyncLock m_StaticTagValues.SyncRoot
                For Each TagItems In Tags
                    Dim TagID As String = GetPropValue(TagItems, "TagName")
                    Dim SimType As SimTypes = GetPropValue(TagItems, "SimType")
                    Dim Value As Object
                    Select Case SimType
                        Case SimTypes.Dynamic
                            Dim DynamicType As DynamicSimTypes = GetPropValue(TagItems, "DynamicSimType")
                            Select Case DynamicType
                                Case DynamicSimTypes.Ramp
                                    Value = localSeconds * 100 / 60
                                Case DynamicSimTypes.Random
                                    Value = Rnd() * 100
                                Case DynamicSimTypes.Sine
                                    Value = Math.Sin(Math.PI * (localSeconds * 360 / 60) / 180.0)
                            End Select
                        Case SimTypes.Static
                            If m_StaticTagValues.Contains(TagID) Then
                                Value = m_StaticTagValues(TagID)
                            Else
                                Value = 0
                            End If
                    End Select
                    Dim Quality As Boolean = False
                    If Not (Value Is Nothing) Then
                        Quality = True
                    End If
                    localArrayList.Add(New ClassTagValue(TagID, Value, currentTime, Quality))
                Next
            End SyncLock

            Return CType(localArrayList.ToArray(GetType(ClassTagValue)), ClassTagValue())
        Catch ex As Exception
            m_OASDriverInterface.UpdateSystemError(True, "Communications", 3, "SyncRead Exception: " + ex.Message)
        End Try

    End Function
C#
// This call is performed when a Device Read is executed in OAS.
public override ClassTagValue[] SyncRead(List[] Tags) {
  try {
    DateTime currentTime = DateTime.Now;
    double localSeconds = currentTime.Second + (currentTime.Millisecond / 1000.0);
    ArrayList localArrayList = new ArrayList();

    lock (m_StaticTagValues.SyncRoot) {
      foreach (List TagItems in Tags) {
        string TagID = Convert.ToString(GetPropValue(TagItems, "TagName"));
        SimTypes SimType = (MyExampleOASDriver.DriverInterface.SimTypes)GetPropValue(TagItems, "SimType");
        object Value = null;
        switch (SimType) {
          case SimTypes.Dynamic:
            DynamicSimTypes DynamicType = (MyExampleOASDriver.DriverInterface.DynamicSimTypes)GetPropValue(TagItems, "DynamicSimType");
            switch (DynamicType) {
              case DynamicSimTypes.Ramp:
                Value = localSeconds * 100 / 60;
                break;
              case DynamicSimTypes.Random:
                Value = Microsoft.VisualBasic.VBMath.Rnd() * 100;
                break;
              case DynamicSimTypes.Sine:
                Value = Math.Sin(Math.PI * (localSeconds * 360 / 60) / 180.0);
                break;
            }
            break;
          case SimTypes.Static:
            if (m_StaticTagValues.Contains(TagID)) {
              Value = m_StaticTagValues[TagID];
            }
            else {
              Value = 0;
            }
            break;
        }
        bool Quality = false;
        if (Value != null) {
          Quality = true;
        }
        localArrayList.Add(new ClassTagValue(TagID, Value, currentTime, Quality));
      }
    }
    return (ClassTagValue[])localArrayList.ToArray(typeof(ClassTagValue));
  }
  catch (Exception ex) {
      m_OASDriverInterface.UpdateSystemError(true, "Communications", 3, "SyncRead Exception: " + ex.Message);
  }
  return null;
}
Step 12
Add code to the WriteValues method that passes a list Tag name, values to be written, and a list of property values for each Tag. This section of code is where you would receive tag names, values, and properties defined in the OAS Platform for each tag for tags that are to be written.
In this example simulation the values are added to the m_StaticTagValues collection for persistence in this simulation, most likely they would be sent back to the data source of you are implementing a writeable interface to your source.
    Public Overrides Sub WriteValues(ByVal TagIDs() As String, ByVal Values() As Object, TagProperties() As List(Of ClassProperty))
        Try
            'Add write Logic to actual driver
            Dim Index As Int32
            For Index = 0 To TagIDs.GetLength(0) - 1
                Dim SimType As SimTypes = GetPropValue(TagProperties(Index), "SimType")
                If SimType = SimTypes.Static Then
                    SyncLock m_StaticTagValues.SyncRoot
                        If m_StaticTagValues.Contains(TagIDs(Index)) Then
                            m_StaticTagValues(TagIDs(Index)) = Values(Index)
                        Else
                            m_StaticTagValues.Add(TagIDs(Index), Values(Index))
                        End If
                    End SyncLock
                End If
            Next
        Catch ex As Exception
            m_OASDriverInterface.UpdateSystemError(True, "Communications", 4, "WriteValues Exception: " + ex.Message)
        End Try
    End Sub
C#
public override void WriteValues(string[] TagIDs, object[] Values, List[] TagProperties) {
  try {
    //Add write Logic to actual driver
    int Index = 0;
    for (Index = 0; Index < TagIDs.GetLength(0); Index++) {
      SimTypes SimType = (MyExampleOASDriver.DriverInterface.SimTypes)GetPropValue(TagProperties[Index], "SimType");
      if (SimType == SimTypes.Static) {
        lock (m_StaticTagValues.SyncRoot) {
          if (m_StaticTagValues.Contains(TagIDs[Index])) {
            m_StaticTagValues[TagIDs[Index]] = Values[Index];
          }
          else {
            m_StaticTagValues.Add(TagIDs[Index], Values[Index]);
          }
        }
      }
    }
  }
  catch (Exception ex) {
      m_OASDriverInterface.UpdateSystemError(true, "Communications", 4, "WriteValues Exception: " + ex.Message);
  }
}
Step 13
Add code for continuous polling that will obtain values for the tags and call the method AsyncReadCallback on the OAS Driver Interface object which will pass an array of tag values.
This code is triggered by the Timer that is started and stopped in the Connect and Disconnect methods. In this routine, you would perform periodic updates on your Tags and mark them as updated by recording an associated timestamp in the m_LastUpdateTime collection.
You can also see in this example that our Tags marked as “Dynamic” are provided calculated values, and “Static” tags pull values from the m_StaticTagValues collection which is set in the WriteValues routine.
    ' This is a simple example of getting the properties of a tag and using that to generate a update to the tag value
    Private Sub TimerRoutine(ByVal State As Object)
        Try
            If m_InTimerRoutine Then
                Exit Sub
            End If
            m_InTimerRoutine = True
            Dim currentTime As Date = Now
            Dim localSeconds As Double = currentTime.Second + (currentTime.Millisecond / 1000)

            Dim localArrayList As New ArrayList

            SyncLock m_Tags.SyncRoot
                SyncLock m_StaticTagValues.SyncRoot
                    Dim TagItems As List(Of ClassProperty)
                    For Each de As DictionaryEntry In m_Tags
                        Dim TagID As String = de.Key
                        TagItems = de.Value

                        ' Just simulating using the PollingRate property
                        Dim OKToPoll As Boolean = True
                        If m_LastUpdateTime.Contains(TagID) Then
                            Dim PollingRate As Double = GetPropValue(TagItems, "PollingRate")
                            Dim lastUpdateTime As Date = m_LastUpdateTime(TagID)
                            If lastUpdateTime.AddSeconds(PollingRate) > currentTime Then
                                OKToPoll = False
                            End If
                        End If

                        If OKToPoll Then
                            If m_LastUpdateTime.Contains(TagID) Then
                                m_LastUpdateTime(TagID) = currentTime
                            Else
                                m_LastUpdateTime.Add(TagID, currentTime)
                            End If
                            Dim SimType As SimTypes = GetPropValue(TagItems, "SimType")
                            Dim Value As Object
                            Select Case SimType
                                Case SimTypes.Dynamic
                                    Dim DynamicType As DynamicSimTypes = GetPropValue(TagItems, "DynamicSimType")
                                    Select Case DynamicType
                                        Case DynamicSimTypes.Ramp
                                            Value = localSeconds * 100 / 60
                                        Case DynamicSimTypes.Random
                                            Value = Rnd() * 100
                                        Case DynamicSimTypes.Sine
                                            Value = Math.Sin(Math.PI * (localSeconds * 360 / 60) / 180.0)
                                    End Select
                                Case SimTypes.Static
                                    If m_StaticTagValues.Contains(TagID) Then
                                        Value = m_StaticTagValues(TagID)
                                    Else
                                        Value = 0
                                    End If
                            End Select
                            Dim Quality As Boolean = False
                            If Not (Value Is Nothing) Then
                                Quality = True
                            End If
                            ' You can include multiple values to the same tag with different timestamps in the same callback if you like.
                            ' In this example it just updates when the timer fires and the check for the PollingRate succeeds.
                            localArrayList.Add(New ClassTagValue(TagID, Value, currentTime, Quality))

                        End If
                    Next
                End SyncLock
            End SyncLock

            If localArrayList.Count > 0 Then
                ' Send values to OAS Service
                m_OASDriverInterface.AsyncReadCallback(CType(localArrayList.ToArray(GetType(ClassTagValue)), ClassTagValue()))
            End If

            ' The following can be used in any routine to post an error during Runtime operation of OAS.
            'm_OASDriverInterface.UpdateSystemError(True, "Communications", 1, "An example of posting a system error")

        Catch ex As Exception
            m_OASDriverInterface.UpdateSystemError(True, "Communications", 5, "TimerRoutine Exception: " + ex.Message)
        End Try
        m_InTimerRoutine = False
    End Sub
C#
// This is a simple example of getting the properties of a tag and using that to generate a update to the tag value
private void TimerRoutine(object State) {
  try {
    if (m_InTimerRoutine) {
      return;
    }
    m_InTimerRoutine = true;
    DateTime currentTime = DateTime.Now;
    double localSeconds = currentTime.Second + (currentTime.Millisecond / 1000.0);
    ArrayList localArrayList = new ArrayList();

    lock (m_Tags.SyncRoot) {
      lock (m_StaticTagValues.SyncRoot) {
        List TagItems = null;
        foreach (DictionaryEntry de in m_Tags) {
          string TagID = Convert.ToString(de.Key);
          TagItems = (List)de.Value;

          // Just simulating using the PollingRate property
          bool OKToPoll = true;
          if (m_LastUpdateTime.Contains(TagID)) {
            double PollingRate = Convert.ToDouble(GetPropValue(TagItems, "PollingRate"));
            DateTime lastUpdateTime = Convert.ToDateTime(m_LastUpdateTime[TagID]);
            if (lastUpdateTime.AddSeconds(PollingRate) > currentTime) {
              OKToPoll = false;
            }
          }

          if (OKToPoll) {
            if (m_LastUpdateTime.Contains(TagID)) {
              m_LastUpdateTime[TagID] = currentTime;
            }
            else {
              m_LastUpdateTime.Add(TagID, currentTime);
            }
            SimTypes SimType = (MyExampleOASDriver.DriverInterface.SimTypes)GetPropValue(TagItems, "SimType");
            object Value = null;
            switch (SimType) {
              case SimTypes.Dynamic:
                DynamicSimTypes DynamicType = (MyExampleOASDriver.DriverInterface.DynamicSimTypes)GetPropValue(TagItems, "DynamicSimType");
                switch (DynamicType) {
                  case DynamicSimTypes.Ramp:
                    Value = localSeconds * 100 / 60;
                    break;
                  case DynamicSimTypes.Random:
                    Value = Microsoft.VisualBasic.VBMath.Rnd() * 100;
                    break;
                  case DynamicSimTypes.Sine:
                    Value = Math.Sin(Math.PI * (localSeconds * 360 / 60) / 180.0);
                    break;
                }
                break;
              case SimTypes.Static:
                if (m_StaticTagValues.Contains(TagID)) {
                  Value = m_StaticTagValues[TagID];
                }
                else {
                  Value = 0;
                }
                break;
            }
            bool Quality = false;
            if (Value != null) {
              Quality = true;
            }
            // You can include mutiple values to the same tag with different timestamps in the same callback if you like.
            // In this example it just updates when the timer fires and the check for the PollingRate succeeds.
            localArrayList.Add(new ClassTagValue(TagID, Value, currentTime, Quality));
          }
        }
      }
    }
    if (localArrayList.Count > 0)
    {
      // Send values to OAS Service
      m_OASDriverInterface.AsyncReadCallback((ClassTagValue[])localArrayList.ToArray(typeof(ClassTagValue)));
    }

    // The following can be used in any routine to post an error during Runtime operation of OAS.
    //m_OASDriverInterface.UpdateSystemError(True, "Communications", 1, "An example of posting a system error")
  }
  catch (Exception ex) {
      m_OASDriverInterface.UpdateSystemError(true, "Communications", 5, "TimerRoutine Exception: " + ex.Message);
  }
  m_InTimerRoutine = false;
}
Step 14
To post a System Error to OAS call the method UpdateSystemError on the OAS Driver Interface object.
Set the first parameter to true to post the System Error as active and false to clear the System Error that has been previously posted.
Specify a Category to group the error along with a unique MessageID.
VB
m_OASDriverInterface.UpdateSystemError(True, "myCategory", 1, "Error message to display")
C#
if (UpdateSystemError != null)
     m_OASDriverInterface.UpdateSystemError(true, "myCategory", 1, "Message to display when error is cleared");
NEXT STEPS
Creating a Hosting App
Once you have compiled the custom Driver assembly, your next step will be to Create a Hosting Application that will load the assembly and run it. This application can be any .NET app, but for most deployments, you will be creating a .NET Windows Service or a Console Application. Services are perfect for deployment on a Windows platform, and Console Applications, when written using .NET Core, can be hosted on non-Windows operating systems like Linux and Mac. Additionally, you can create an Android or iOS app using the Xamarin development tools within Visual Studio.
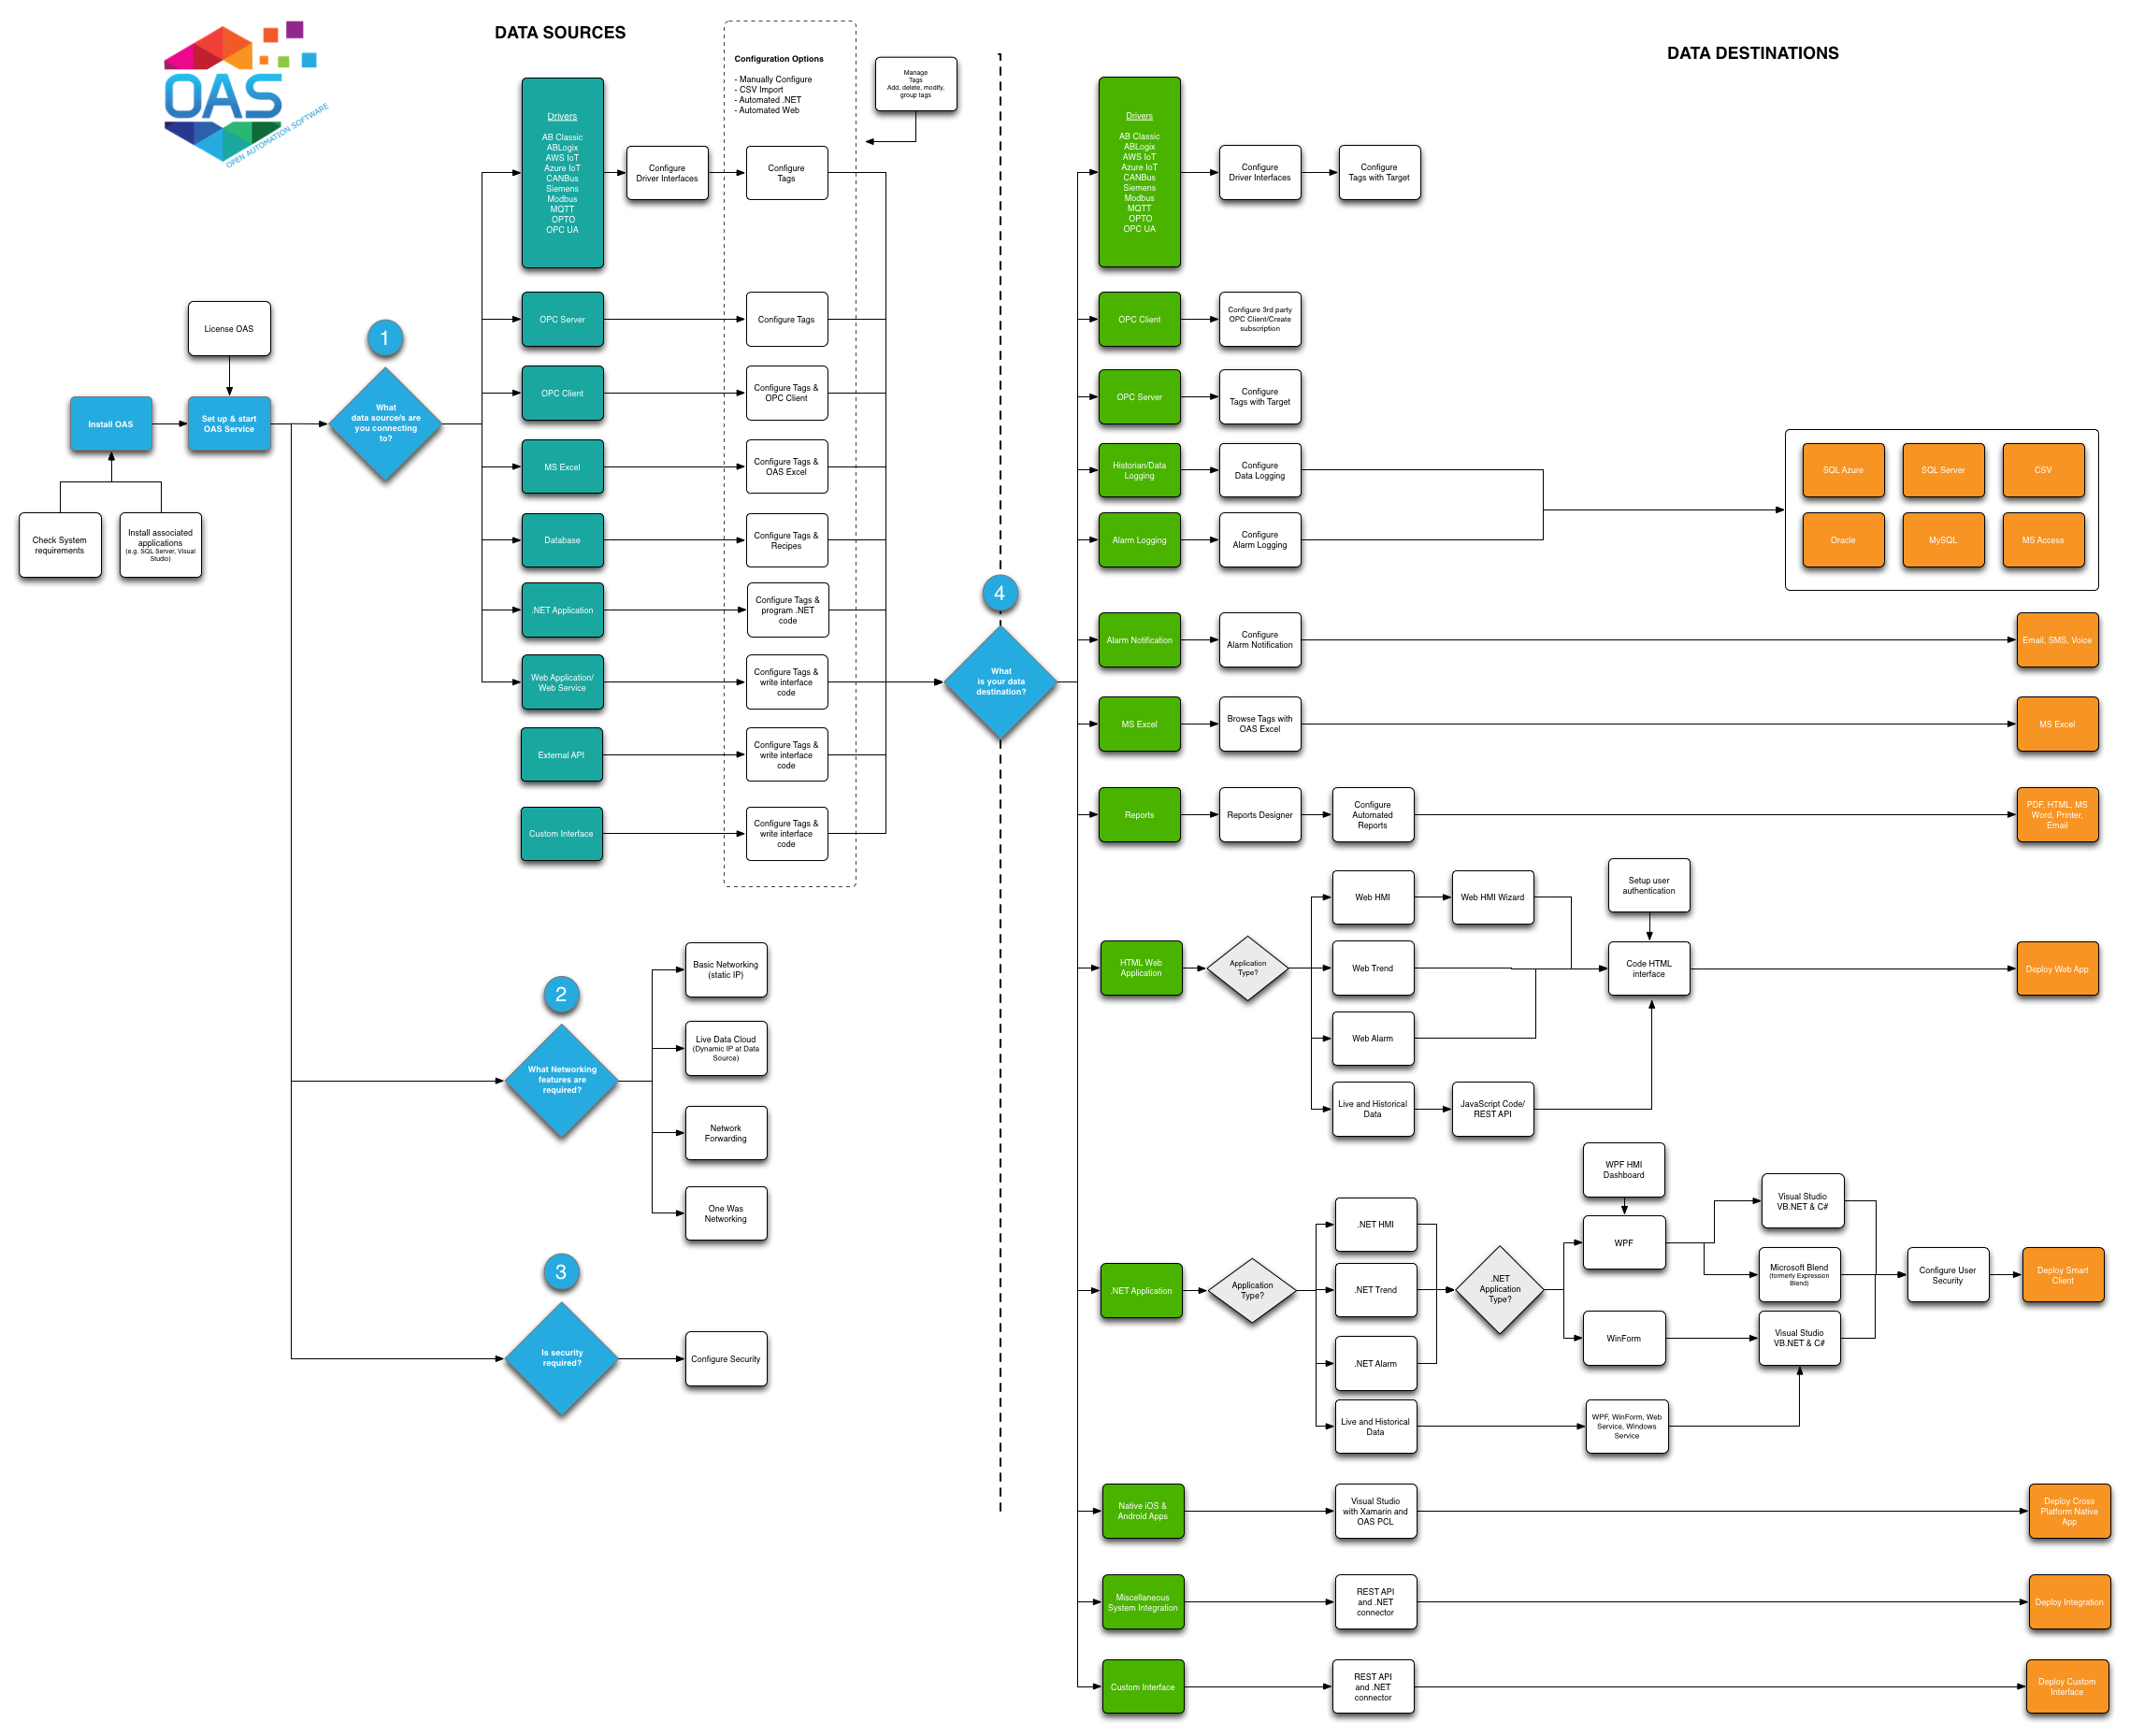
Software Workflow
Open Automation Software Workflow
Programmatic Access Methods – Protocols and Tools for Creating Applications
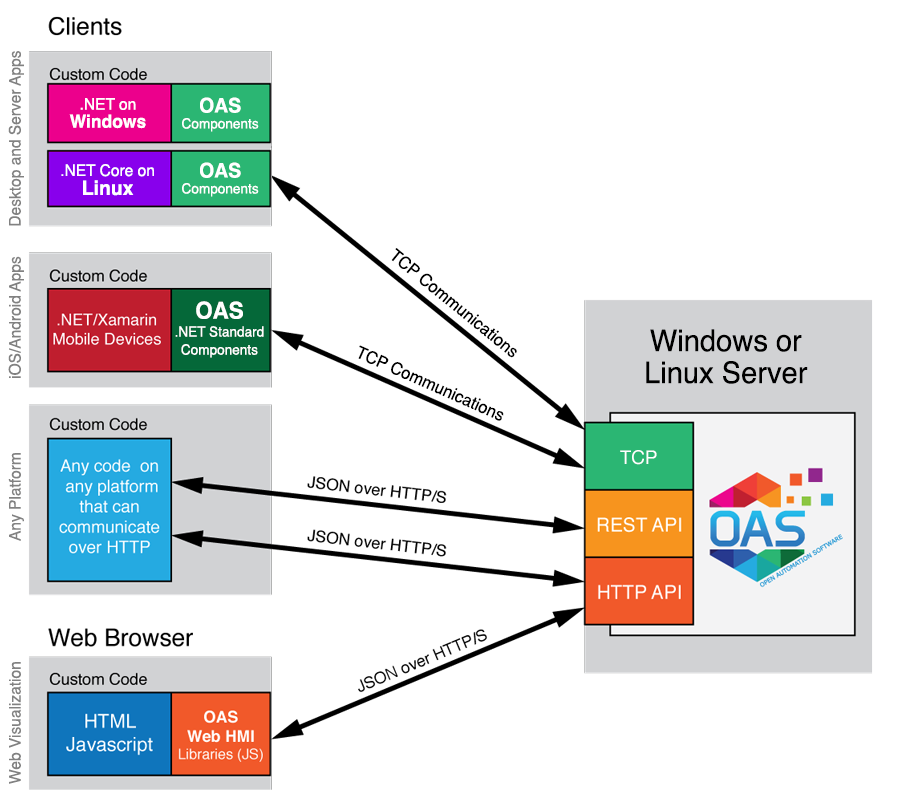
Getting started: OAS REST API and native iOS
Step 1
To read and write data between a native iOS app and OAS, you can use the OAS REST API. As a first step, register the HTTP listener with the OAS Service Control Manager under the section labeled “HTML HMI Registration”.
Define the exclusive Node Name and Port Number that is to be supported. The Node Name should be the registered domain name, IP address, or network node name that all clients will connect to from their browsers. If you are unsure of which node name to use, localhost will work in most cases.
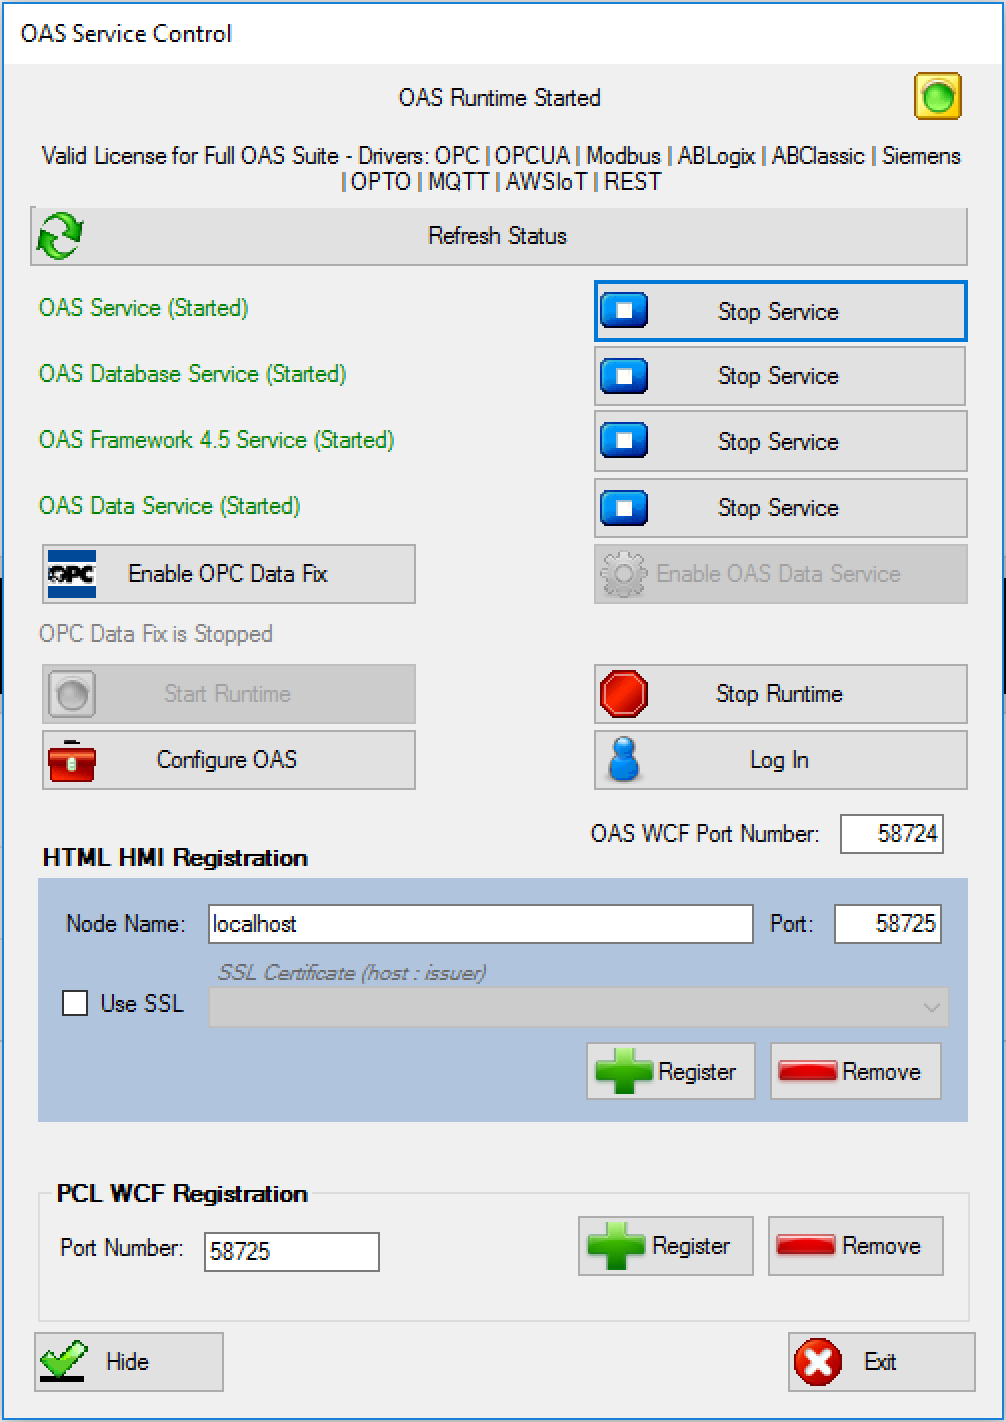
NOTE: Before clicking “Register”, be sure to stop all services. If services are running, the Service Control app will prompt you to stop them.
Step 2
Start up all services, and be sure to include the Framework 4.5 Service as this houses the listener specific to the REST API.
Step 3
Test your API Service from your iOS device.
You will now ensure that your iPhone or iPad can communicate with OAS via the REST API. In this example, the OAS host is located at 192.168.0.101 on the local network, but you will have to replace this with the OAS host node on your network. The base URL you will use to connect to the REST API is http://{{node}}:{{port}}/OASREST/v2. Each operation performed against the REST API will use the specific operation name prepended with the base {{url}}. The first operation to complete is authentication. All sessions with the REST API must be authenticated. You can adjust the {{url}} in the following snippet and test authentication. In Xcode, create a new single-view iOS application, and choose Swift as the language. Add the following code to MainViewController.swift:
Authenticate Session (Swift):
import requests
import json

### base url is http://{{node}}:{{port}}/OASREST/v2/
url = 'http://192.168.0.101:58725/OASREST/v2'  # {{url}}
op = '/authenticate'                           # {{operation}}
data = '''{"username":"", "password":""}'''
headers = {'Content-Type':'application/json'}

### Authentication is completed via a POST request
response = requests.request("POST", url+op, data=data,
                             headers=headers)

print(response.text)

### Upon success, store your clientid and token for the remainder of the session
json_data = json.loads(response.text)
clientid = json_data["data"]["clientid"]
token = json_data["data"]["token"]
If this code is executed without error, the response will include a clientid and token. These will be included in the header for all other operations.
{
  "status":"OK",
  "data":{"clientid":"531041fa-e601-49d7-a02a-cf13f12eae28",
          "token":"919a303c-4537-4658-b4bf-242fc44e6493"},
  "messages":["Default credential provided"]
}
Here are some Python examples of basic HTTP requests you might wish to make via the REST API after having completed authentication. For additional information, see our REST API documentation.
Create a Tag (Python 3):
### code continues from above
### Create a Tag
headers.update({"clientid":clientid})
headers.update({"token":token})
operation = '/tags'
data = '''
{
   "path":"SomeDummyTag",
   "parameters": {
        "Value": {
            "DataType":"Double",
            "ParameterSource":"Value",
            "Value":"262.262"
        }
    }
}
'''
response = requests.request('POST', url+operation, data=data, headers=headers)
print(response.text)
Successful tag creation results in the following response from the OAS server:
{"status":"OK","messages":["CREATE COMPLETE"]}
Read a Tag (Python 3):
Reading a tag is accomplished with a GET request, using a simple query including the path to the Tag.
### Read a Tag
### operation = '/tags'
querystring= {'path':'SomeDummyTag'}
response = requests.request('GET', url+operation, params=querystring, headers=headers)
print(response.text)
A possible response from the OAS server:
[{"path":"SomeDummyTag","value":"262.262","quality":true,"type":"Float","timestamp":1521742596474}]
Update a Tag (Python 3):
Updating a tag is accomplished with a PUT request, using a payload including the path to the Tag, and the parameter(s) to be updated.
### Update a tag
### operation = '/tags'
data = '''
{
    "path":"SomeDummyTag",
    "parameters": {
        "Value": {
            "Value":"54.59"
        }
    }
}
'''
response = requests.request('PUT', url+operation, data=data, headers=headers)
print(response.text)
Update confirmation from the OAS server:
{"status":"OK","messages":["UPDATE COMPLETE"]}
Step 4
Write tag data from Raspberry Pi to OAS.
Now that you’ve established connectivity with the REST API, you can complete a Python script to write data from your device. Here is an example script which detects when a button is pushed, and forwards that data into OAS as a discrete tag value. An LED on the breadboard (see figure) indicates the current value, and the OAS server is polled at a frequency of 1 Hz to reflect the current state.
import RPi.GPIO as GPIO
import time
import requests
import json

### Define a function to toggle the state of PiBit
### (You will likely prefer to inject all dependencies in production code)
def toggleBit(state):
    data = '''{"path":"PiBit",
               "parameters":{
                   "Value":{
                       "Value":"'''+str(not state)+'''"
    }}}'''
    requests.request('PUT', url+operation, data=data, headers=headers)
    return not state

### read state of Boolean Tag
def readBooleanTag(tagName):
    querystring = {'path':tagName}
    response = requests.request('GET', url+operation, params=querystring, headers=headers)
    json_response = json.loads(response.text)
    test = json_response[0]["value"]
    return test == "True"

### Write a callback function to execute on event detection
def callback(input_pin):
    print("Input on pin",input_pin)
    current_state = GPIO.input(40)
    toggleBit(current_state)
    GPIO.output(40, not current_state)

### Authenticate session
url = 'http://192.168.0.101:58725/OASREST/v2'
operation = '/authenticate'
data = '''
{
    "username":"",
    "password":""
}
'''
headers = {"Content-Type":"application/json"}
response = requests.request('POST', url+operation, data=data, headers=headers)

### Update headers with clientid and token
json_data = json.loads(response.text)
clientid = json_data["data"]["clientid"]
token = json_data["data"]["token"]
headers.update({"clientid":clientid})
headers.update({"token":token})


### Create a tag to store a boolean
operation = '/tags'
data = '''
{
    "path":"PiBit",
    "parameters": {
         "Value": {
             "DataType":"Discrete",
             "ParameterSource":"Value",
             "Value":"False"
         }
    }
}
'''
response = requests.request('POST', url+operation, data=data, headers=headers)

### Setup Raspberry Pi IO board
GPIO.setmode(GPIO.BOARD)
GPIO.setup(36, GPIO.IN, pull_up_down=GPIO.PUD_UP)
GPIO.setup(40, GPIO.OUT)
GPIO.output(40, False)

### Detect when input voltage drops, and poll server for current state
GPIO.add_event_detect(36, GPIO.FALLING, callback=cb, bouncetime=100)
try:
    while True:
        time.sleep(1)
        print(readBooleanTag("PiBit"))
except KeyboardInterrupt:
    print("\nExiting\n")
    GPIO.cleanup()
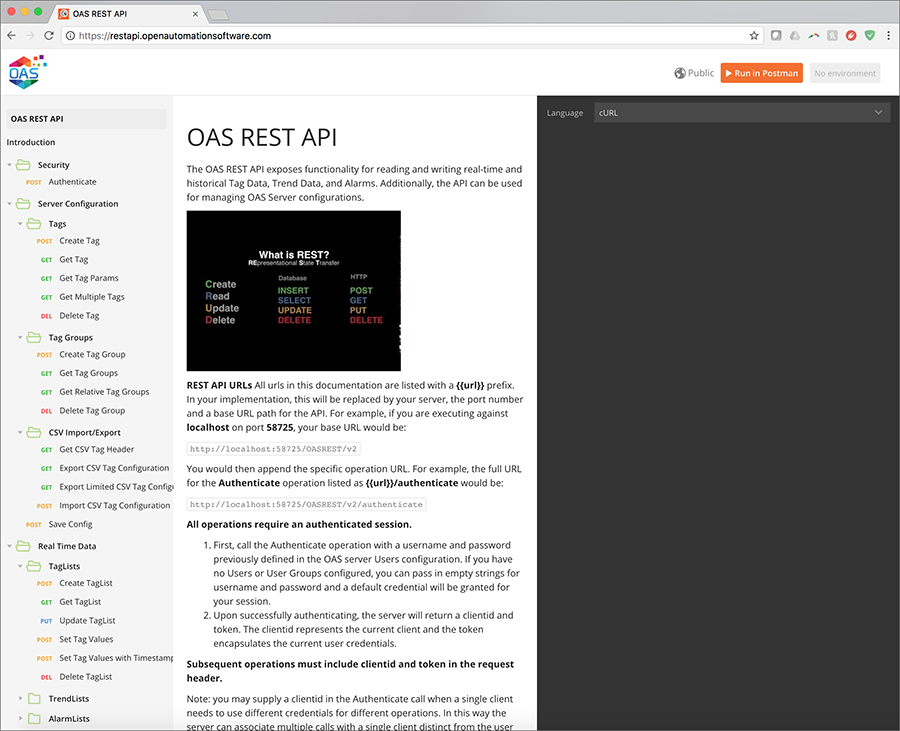
For further help with the REST API, navigate to https://restapi.openautomationsoftware.com to open the REST API online documentation.
Writing data from Raspberry Pi using OAS REST API
Step 1
To write data into OAS from a Raspberry Pi, you will use the OAS REST API. As a first step, register the HTTP listener with the OAS Service Control Manager under the section labeled “HTML HMI Registration”.
Define the exclusive Node Name and Port Number that is to be supported. The Node Name should be the registered domain name, IP address, or network node name that all clients will connect to from their browsers. If you are unsure of which node name to use, localhost will work in most cases.
NOTE: Before clicking “Register”, be sure to stop all services. If services are running, the Service Control app will prompt you to stop them.
Step 2
Start up all services, and be sure to include the Framework 4.5 Service as this houses the listener specific to the REST API.
Step 3
Test your API Service from your Raspberry Pi.
You will now ensure that the Raspberry Pi can communicate with OAS via the REST API. In this example, the OAS host is located at 192.168.0.101 on the local network, but you will have to replace this with the OAS host node on your network. The base URL you will use to connect to the REST API is http://{{node}}:{{port}}/OASREST/v2. Each operation performed against the REST API will use the specific operation name prepended with the base {{url}}. The first operation to complete is authentication. All sessions with the REST API must be authenticated. You can adjust the {{url}} in the following snippet and test authentication.
Authenticate Session (Python 3):
import requests
import json

### base url is http://{{node}}:{{port}}/OASREST/v2/
url = 'http://192.168.0.101:58725/OASREST/v2'  # {{url}}
op = '/authenticate'                           # {{operation}}
data = '''{"username":"", "password":""}'''
headers = {'Content-Type':'application/json'}

### Authentication is completed via a POST request
response = requests.request("POST", url+op, data=data,
                             headers=headers)

print(response.text)

### Upon success, store your clientid and token for the remainder of the session
json_data = json.loads(response.text)
clientid = json_data["data"]["clientid"]
token = json_data["data"]["token"]
If this code is executed without error, the response will include a clientid and token. These will be included in the header for all other operations.
{
  "status":"OK",
  "data":{"clientid":"531041fa-e601-49d7-a02a-cf13f12eae28",
          "token":"919a303c-4537-4658-b4bf-242fc44e6493"},
  "messages":["Default credential provided"]
}
Here are some Python examples of basic HTTP requests you might wish to make via the REST API after having completed authentication. For additional information, see our REST API documentation.
Create a Tag (Python 3):
### code continues from above
### Create a Tag
headers.update({"clientid":clientid})
headers.update({"token":token})
operation = '/tags'
data = '''
{
   "path":"SomeDummyTag",
   "parameters": {
        "Value": {
            "DataType":"Double",
            "ParameterSource":"Value",
            "Value":"262.262"
        }
    }
}
'''
response = requests.request('POST', url+operation, data=data, headers=headers)
print(response.text)
Successful tag creation results in the following response from the OAS server:
{"status":"OK","messages":["CREATE COMPLETE"]}
Read a Tag (Python 3):
Reading a tag is accomplished with a GET request, using a simple query including the path to the Tag.
### Read a Tag
### operation = '/tags'
querystring= {'path':'SomeDummyTag'}
response = requests.request('GET', url+operation, params=querystring, headers=headers)
print(response.text)
A possible response from the OAS server:
[{"path":"SomeDummyTag","value":"262.262","quality":true,"type":"Float","timestamp":1521742596474}]
Update a Tag (Python 3):
Updating a tag is accomplished with a PUT request, using a payload including the path to the Tag, and the parameter(s) to be updated.
### Update a tag
### operation = '/tags'
data = '''
{
    "path":"SomeDummyTag",
    "parameters": {
        "Value": {
            "Value":"54.59"
        }
    }
}
'''
response = requests.request('PUT', url+operation, data=data, headers=headers)
print(response.text)
Update confirmation from the OAS server:
{"status":"OK","messages":["UPDATE COMPLETE"]}
Step 4
Write tag data from Raspberry Pi to OAS.
Now that you’ve established connectivity with the REST API, you can complete a Python script to write data from your device. Here is an example script which detects when a button is pushed, and forwards that data into OAS as a discrete tag value. An LED on the breadboard indicates the current value, and the OAS server is polled at a frequency of 1 Hz to reflect the current state.
import RPi.GPIO as GPIO
import time
import requests
import json

### Define a function to toggle the state of PiBit
### (You will likely prefer to inject all dependencies in production code)
def toggleBit(state):
    data = '''{"path":"PiBit",
               "parameters":{
                   "Value":{
                       "Value":"'''+str(not state)+'''"
    }}}'''
    requests.request('PUT', url+operation, data=data, headers=headers)
    return not state

### read state of Boolean Tag
def readBooleanTag(tagName):
    querystring = {'path':tagName}
    response = requests.request('GET', url+operation, params=querystring, headers=headers)
    json_response = json.loads(response.text)
    test = json_response[0]["value"]
    return test == "True"

### Write a callback function to execute on event detection
def callback(input_pin):
    print("Input on pin",input_pin)
    current_state = GPIO.input(40)
    toggleBit(current_state)
    GPIO.output(40, not current_state)

### Authenticate session
url = 'http://192.168.0.101:58725/OASREST/v2'
operation = '/authenticate'
data = '''
{
    "username":"",
    "password":""
}
'''
headers = {"Content-Type":"application/json"}
response = requests.request('POST', url+operation, data=data, headers=headers)

### Update headers with clientid and token
json_data = json.loads(response.text)
clientid = json_data["data"]["clientid"]
token = json_data["data"]["token"]
headers.update({"clientid":clientid})
headers.update({"token":token})


### Create a tag to store a boolean
operation = '/tags'
data = '''
{
    "path":"PiBit",
    "parameters": {
         "Value": {
             "DataType":"Discrete",
             "ParameterSource":"Value",
             "Value":"False"
         }
    }
}
'''
response = requests.request('POST', url+operation, data=data, headers=headers)

### Setup Raspberry Pi IO board
GPIO.setmode(GPIO.BOARD)
GPIO.setup(36, GPIO.IN, pull_up_down=GPIO.PUD_UP)
GPIO.setup(40, GPIO.OUT)
GPIO.output(40, False)

### Detect when input voltage drops, and poll server for current state
GPIO.add_event_detect(36, GPIO.FALLING, callback=callback, bouncetime=100)
try:
    while True:
        time.sleep(1)
        print(readBooleanTag("PiBit"))
except KeyboardInterrupt:
    print("\nExiting\n")
    GPIO.cleanup()
For further help with the REST API, navigate to https://restapi.openautomationsoftware.com to open the REST API online documentation.
Read Database Data
Use the OPCSystems.dll assembly to call GetDatabaseData to return a DataTable of values from a database table or view.
- The GetDatabaseData function returns a DataTable of values from the local or remote service by obtaining database values where the service is running.
- Returns blank DataTable if service is not reachable.
- DBProvider is the database provider type to use.
- DBServer is the database server to connect to. Not applicable for MS Access and Oracle.
- TableOrView is the table name or view name to query the data from.
- MSSQLWindowsAuthentication – when connecting with SQL Server use Windows Authentication. When false specify the DBUser and DBPassword for SQL user login.
- DBUser is the user name for security authentication. Not applicable if using SQL Server and MSSQLWindowsAuthentication is set to true.
- DBPassword is the password for security authentication. Not applicable if using SQL Server and MSSQLWindowsAuthentication is set to true.
- FieldNames is a string array containing the field names to query from the table for view.
- DataTypes is an array of field data types for the fields.
- UseDates will enable using the StartDate and EndDate.
- StartDate as the start date and time of history to retrieve.
- EndDate as the end date and time of history to retrieve.
- QueryString is the WHERE condition to append to the query. When blank it is not used.
- NetworkNode is the name of the network node of the OPC Systems Service to connect to. Leave blank for localhost connection.
- ErrorString will be set to Success when function is successful and an error message when in error.
- RemoteSCADAHostingName is the name of the Live Data Cloud OPC Systems Service to connect to.
VB
        Private Sub ButtonGetDatabaseData_Click(sender As System.Object, e As System.EventArgs) Handles ButtonGetDatabaseData.Click
        Dim m_OPCSystemsComponent1 As New OPCSystems.OPCSystemsComponent

        Dim returnedDataTable As DataTable

        Dim localDBProvider As OPCSystems.OPCSystemsComponent.DBProviderTypes = OPCSystems.OPCSystemsComponent.DBProviderTypes.SQLServer
        Dim localDBServer As String = "OAS_SONY\SQLOAS"
        Dim database As String = "TestDB"
        Dim table As String = "TestCont"
        Dim useWindowsAuthentication As Boolean = True
        Dim user As String = ""
        Dim password As String = ""

        Dim FieldNames(3) As String
        FieldNames(0) = "Ramp_Value"
        FieldNames(1) = "Value01_Value"
        FieldNames(2) = "Value02_Value"
        FieldNames(3) = "Value03_Value"


        Dim FieldDataTypes(3) As OPCSystems.OPCSystemsComponent.FieldDataTypes
        FieldDataTypes(0) = OPCSystems.OPCSystemsComponent.FieldDataTypes.DoubleFloatData
        FieldDataTypes(1) = OPCSystems.OPCSystemsComponent.FieldDataTypes.DoubleFloatData
        FieldDataTypes(2) = OPCSystems.OPCSystemsComponent.FieldDataTypes.DoubleFloatData
        FieldDataTypes(3) = OPCSystems.OPCSystemsComponent.FieldDataTypes.DoubleFloatData

        Dim useStartAndEndDates As Boolean = True
        Dim dateTimeFieldName As String = "DateAndTime"
        Dim endDate As Date = Now
        Dim startDate As Date = endDate.AddYears(-1)

        Dim networkNode As String = "localhost"
        Dim errorString As String = ""

        returnedDataTable = m_OPCSystemsComponent1.GetDatabaseData(localDBProvider, localDBServer, database, table, useWindowsAuthentication, user, password, FieldNames, FieldDataTypes, useStartAndEndDates, dateTimeFieldName, startDate, endDate, "", networkNode, errorString)

        DataGridView1.DataSource = returnedDataTable
    End Sub
C#
 private void ButtonGetDatabaseData_Click(object sender, System.EventArgs e)
              {
			OPCSystems.OPCSystemsComponent m_OPCSystemsComponent1 = new OPCSystems.OPCSystemsComponent();

			DataTable returnedDataTable = null;

			OPCSystems.OPCSystemsComponent.DBProviderTypes localDBProvider = OPCSystems.OPCSystemsComponent.DBProviderTypes.SQLServer;
			string localDBServer = "OAS_SONY\\SQLOAS";
			string database = "TestDB";
			string table = "TestCont";
			bool useWindowsAuthentication = true;
			string user = "";
			string password = "";

			string[] FieldNames = new string[4];
			FieldNames[0] = "Ramp_Value";
			FieldNames[1] = "Value01_Value";
			FieldNames[2] = "Value02_Value";
			FieldNames[3] = "Value03_Value";


			OPCSystems.OPCSystemsComponent.FieldDataTypes[] FieldDataTypes = new OPCSystems.OPCSystemsComponent.FieldDataTypes[4];
			FieldDataTypes[0] = OPCSystems.OPCSystemsComponent.FieldDataTypes.DoubleFloatData;
			FieldDataTypes[1] = OPCSystems.OPCSystemsComponent.FieldDataTypes.DoubleFloatData;
			FieldDataTypes[2] = OPCSystems.OPCSystemsComponent.FieldDataTypes.DoubleFloatData;
			FieldDataTypes[3] = OPCSystems.OPCSystemsComponent.FieldDataTypes.DoubleFloatData;

			bool useStartAndEndDates = true;
			string dateTimeFieldName = "DateAndTime";
			DateTime endDate = DateTime.Now;
			DateTime startDate = endDate.AddYears(-1);

			string networkNode = "";
			string errorString = "";

			returnedDataTable = m_OPCSystemsComponent1.GetDatabaseData(localDBProvider, localDBServer, database, table, useWindowsAuthentication, user, password, FieldNames, FieldDataTypes, useStartAndEndDates, dateTimeFieldName, startDate, endDate, "", networkNode, errorString);

			DataGridView1.DataSource = returnedDataTable;
              }
Data Historian
Setting up Data Logging to SQL Server, Oracle, Access, mySQL, SQL Azure