Trends
Displays real time and historical OAS Tag data in a time series chart. Real time data is animated in a sliding customizable timeframe window.
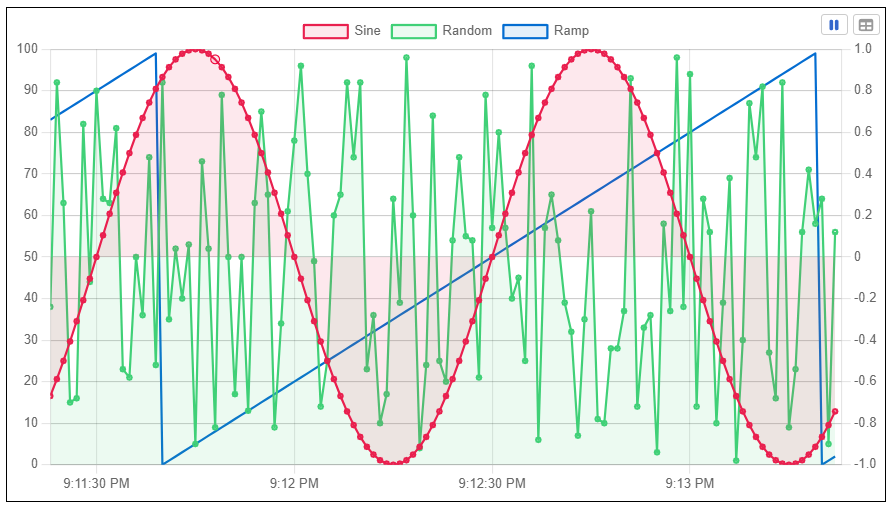
In the upper-right corner of the Component, while real time data is being plotted, you can click the icon to pause the animation.
Also, clicking the icon will toggle display of raw tabular data. While displaying tabular data, you can export the dataset to a local CSV file by clicking the icon.
Properties
| Property | Type | Description |
|---|---|---|
| Tags | Tags | List of OAS Tags and options for how they are plotted on the chart |
| BG Color | Color | Background or fill color behind the component |
| Border | Border | Optional border around the Component |
| Visibility | Boolean | Determines when to show or hide the Component |
Tags
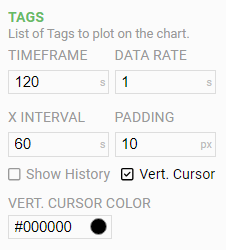
The following are general options for how the chart is rendered
| Option | Description |
|---|---|
| Timeframe | In seconds, this is the amount of time displayed in the chart. Real time data ends at the current date/time with the Timeframe determining how far back to keep data in the window. Historical data will always display the full data set based on the start and end date/times selected |
| Data Rate | In seconds, the interval between each data point. If Tags are sampled at a higher rate than the Data Rate, the value plotted will be an average between samples. If Tags are sampled at a lower rate, multiple repeated data points will be displayed |
| X Interval | In seconds, the interval between labels and grid lines on the y-axis |
| Padding | In pixels, how much padding is applied between the Component border and the chart itself |
| Show History | Enables retrieval of historical data from one or more OAS Data Logging Groups. See below for more detail |
| Vert. Cursor | Switches to a vertical line cursor which will display all values at that timestamp for comparison. If disabled, the default cursor will only show the value of the single pen where the mouse hovers |
| Vert. Cursor Color | The color used for the vertical cursor line. This can be any valid HTML color name, hex value or RGB designation |
Show History
Enabling this option will display input fields for the user to select a start and end date/time to query the OAS Server for historical data.

To display historical data fill in the date/time fields and click the icon. A request will be made to the OAS Server to retrieve logged data for each of the Tags added to the Pen Configuration below.
If data can be retrieved for the timeframe requested, it will be plotted on the chart. You can return to viewing real time data by clicking on the icon.
Additionally, you can use the and buttons to quickly load historical data relative to the current time, using the same timeframe displayed in the real-time data mode.
WARNING
Historical data will only be available for OAS Tags logged using the Data Logging feature of the OAS Server
NOTE: To ensure the Trend Component is usable and performs well, the maximum number of data points per pen allowed is limited to 300k.
For example, this is approx. 3.5 days worth of data logged at a one second rate, or more than 200 days of data logged at a one minute rate.
Pen Configuration
Clicking the icon to select the OAS Tags to plot on the chart, either using the Tag Browser, or by manually entering the Tag name. Once you have selected the Tags, each will be configured in a separate panel.
WARNING
Only OAS Tags marked as a Trend Point in the OAS Server configuration will be available to plot on the Trends Component.
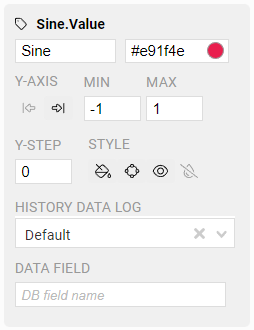
Below the name of the selected OAS Tag are the Label and Color fields. The Label is what gets displayed in the chart's legend, and the Color is used for how the Label and pen markings are displayed.
Additional options for the pen are:
| Option | Description |
|---|---|
| Y-Axis | The position of the y-axis scale for this Tag, either on the left or right side of the chart |
| Min/Max | The minimum and maximum values for controlling the y-axis scale |
| Y-Step | The number of steps between labels and grid lines on the y-axis. Set this to 0 to allow the Component to decide based on the y-axis range |
| Style | Visual styling configurations for the plot lines and y-axis |
| History Data Log | If the OAS Tag is included in multiple Data Logging Groups, you can specify which group to use for requesting historical data |
| Data Field | If a custom name is used for the database field (column), you can specify it here. By default, the OAS Server will replace OAS Tag segments with an underscore when searching for data. For example, the Sine.Value Tag will use a Data Field of Sine_Value. |
Style Options
Fill - fill under the plot line
Points - display markers for each data point
Show y-axis - display the y-axis for this pen
Match y-axis color - render the y-axis using the pen's color