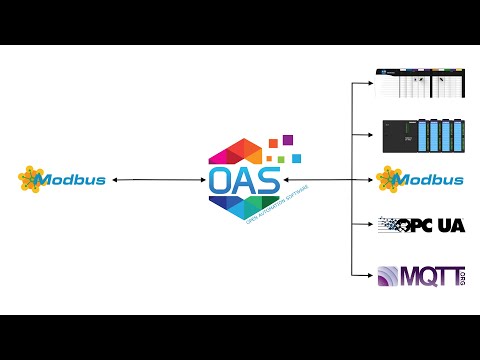
Open Automation Software can interface with Sparkplug B Edge of Network Nodes to receive Metric values with the OAS Host Application driver interface. This tutorial walks you through downloading and installing OAS, configuring a Sparkplug B Host Application driver, configuring tags, configuring alarm limits, and logging alarms to a database. Supported databases include SQL Server, Oracle, Access, PostgreSQL, Cassandra, MongoDB, MariaDB, SQLite, MySQL, SQL Azure, Amazon Aurora, Amazon RDS, and CSV files.
Step 1. Download and Install the Open Automation Software and Start the OAS Service
If you have not already done so, you will need to download and install the OAS platform. Fully functional trial versions of the software are available for Windows, Windows IoT Core, Linux, Raspberry Pi and Docker on our downloads page.
On Windows run the downloaded Setup.exe file to install one or more of the Open Automation Software features. Select the default Typical installation if you are not sure what features to use or the Custom installation if you want to save disk space on the target system. When prompted agree to the End User License Agreement to continue the installation.
For more detailed instructions and video tutorials, visit the installation guide for your system:
Windows Installation | Linux Installation | Raspberry Pi Installation | Dockers Installation
The OAS Service Control application will appear when the installation finishes on Windows. Use this application to start the 3 Services. Run the Configure OAS application on Windows and select Configure-Tags; if the first time running, the AdminCreate utility will run to create an Administrator login as shown in Step 1 of Getting Started – Security.
Step 2. Set Up Sparkplug B Host App to Access EoN Node Data.
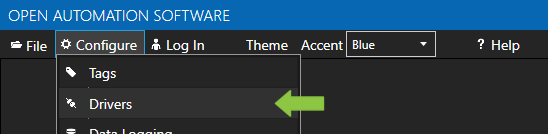
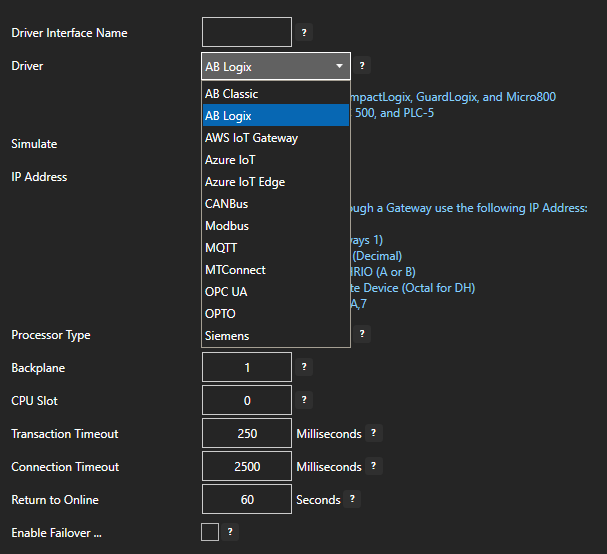
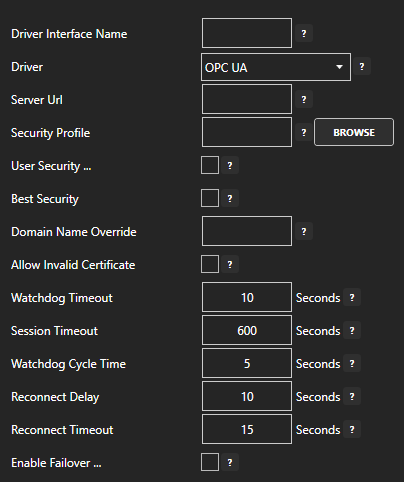
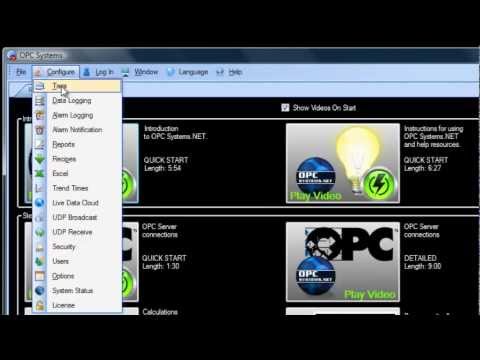
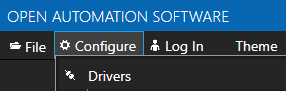
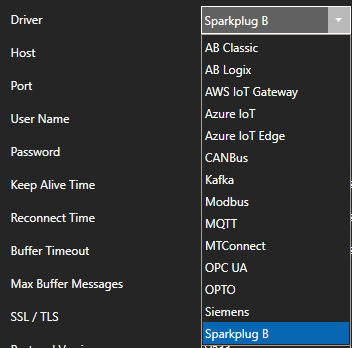
Select Configure-Drivers.
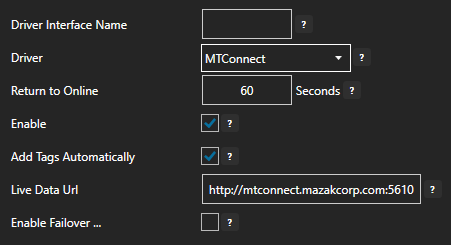
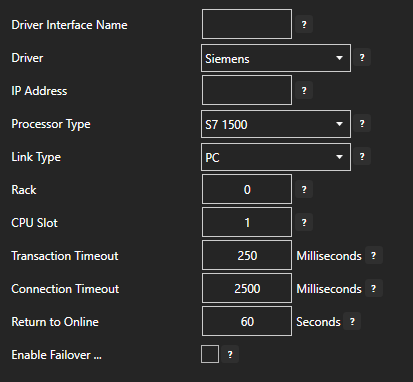
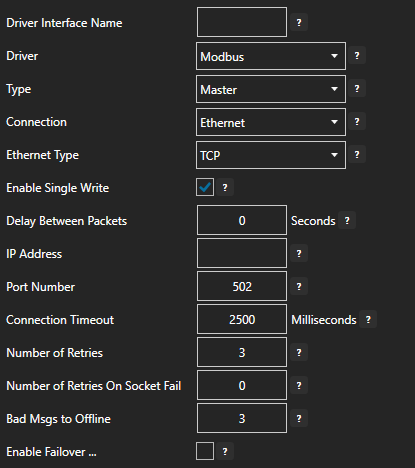
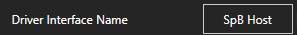
Enter a meaningful Driver Interface Name that you will refer to this connection and define the properties.
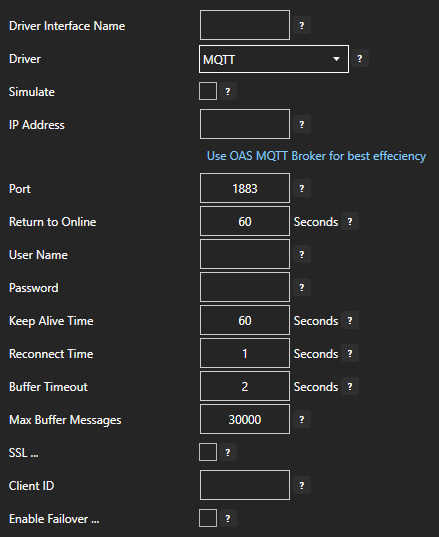
Set the driver to Sparkplug B.
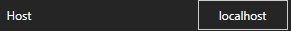
Enter the Host property to the IP Address of the of the host broker or just use localhost for a local broker.
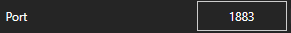
Set the Port property of the host broker to connect to. The default port is 1883 or 8883 for SSL.
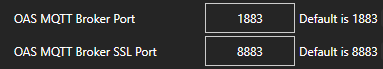
Note: The OAS MQTT Broker can be used to host data locally. To use another broker on the default ports on the same computer change the OAS MQTT Broker Port under Configure-Options-MQTT Broker.
Enter the User Name and Password if required.
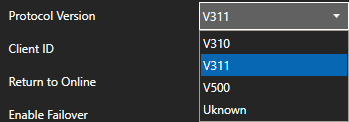
Set the MQTT Protocol Version to V311 or V500.
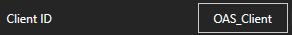
Set the Client ID to a unique value, each driver interface must have a specific value different than all other clients connecting to the host.
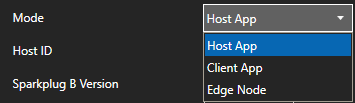
Set the Mode to Host App for OAS to control the online state of each Edge of Node defined to the shared Host Application ID. Or set to Client App to access EoN Node data without controlling their state.
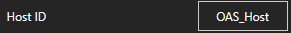
Set the Host ID to the specific value that the Edge of Nodes will be using as the Host Application ID.
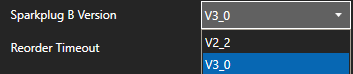
Set the Sparkplug B Version to 2.2 or 3.0.
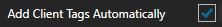
To automatically add tags for each Metric from the matching Group, Edge of Nodes, and Devices enable the property Add Client Tags Automatically.
When enabled optionally set the Filter Groups, Edge Nodes, and Devices that tags should be added from for each of their Metrics. Leave the Filter fields blank to include all Edge of Nodes publishing data to the broker.
Select the Add Driver button in the left part of the form to add the Driver Interface as an available selection when defining Tags in the next step.

You are now ready to add tags for specific Sparkplug B EoN Node Metric values.
Note: If the Driver Interface property Add Client Tags Automatically was enabled tags will be created for you, you can skip this step to add tags manually.
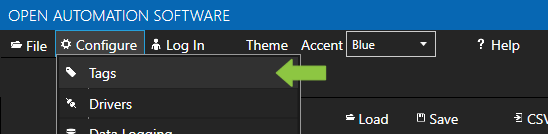
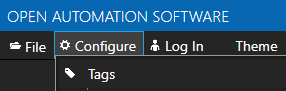
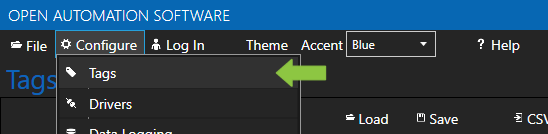
Select Configure-Tags.
Note: You can add organizational Groups as many levels deep as you prefer and add tags to groups. To do this first add a Group to Tags Group at the root level, then right click on the Group in the right window to add additional Groups or Tags.
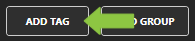
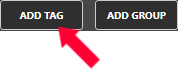
Select Add Tag.
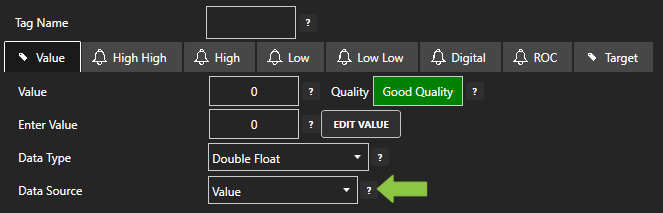
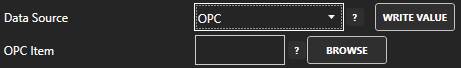
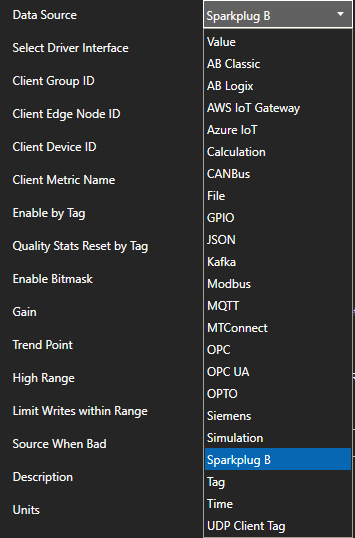
Change the Data Source Tag property to Sparkplug B.
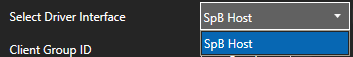
Select the correct Driver Interface from the Driver Interface pull down list.
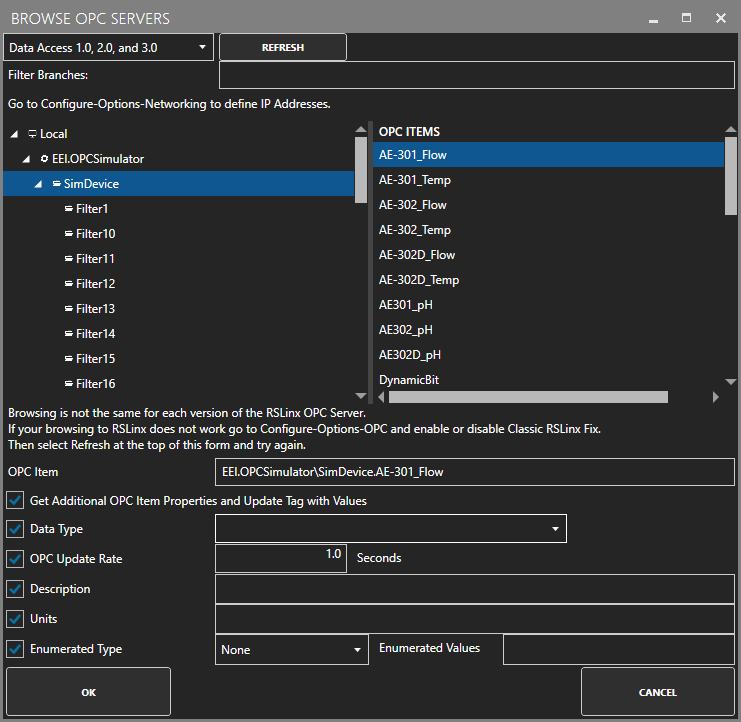
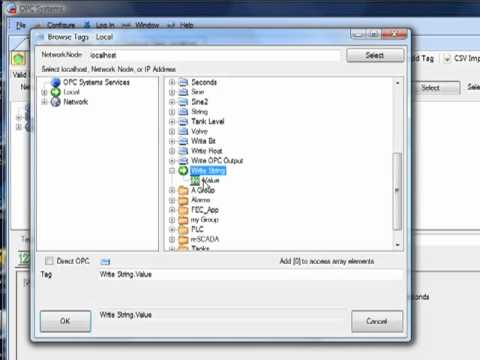
Specify the Client Group ID, Client Edge Node ID, Client Device ID, and Client Metric Name for the Edge of Node Metric value to read and write.
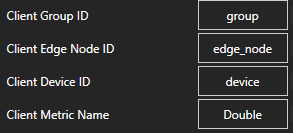
Select the Data Type of the Tag to match the data type of the Metric.
Select Apply Changes and the current value for the Metric should appear with Good Quality.
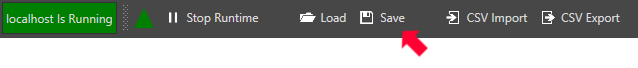
Select the Save button from the toolbar to save your configuration.
You can view the Getting Started with Sparkplug B Video to familiarize yourself with the above steps to setup OAS as a Sparkplug B Edge of Network Node and a Host Application

- 00:00 – Introduction
- 01:10 – Download OAS
- 01:46 – Quick Start
- 02:08 – Edge of Network Node
- 05:52 – EoN Tags
- 07:04 – Host Application
- 09:20 – SpB Client Tags
- 10:22 – Programatic Interface
- 10:59 – CSV Export / Import
- 12:27 – Multiple Metric Tags
- 13:46 – Modbus
- 16:10 – DCMD Metric Write
- 17:00 – Data Route
- 17:58 – Networking
- 18:17 – Save Configuration
- 18:56 – OAS Platform
Step 3. Configure Alarm Limits
- In the OAS Configure Application, select Configure >> Tags from the top menu.
- Select localhost or the remote service you wish to modify with the Select button to the right of the Network Node list.

- Select the tag you wish to set alarm limits for from the tag browser on the left.
- Use the tabs at the top of the tag properties window to configure alarm limits for your tag based on type: High High, High, Low, Low Low, Digital and Rate of Change.

- Check the Enable Alarm checkbox to enabling your alarm limit; alternately, you can use he Enable with Tag…checkbox.
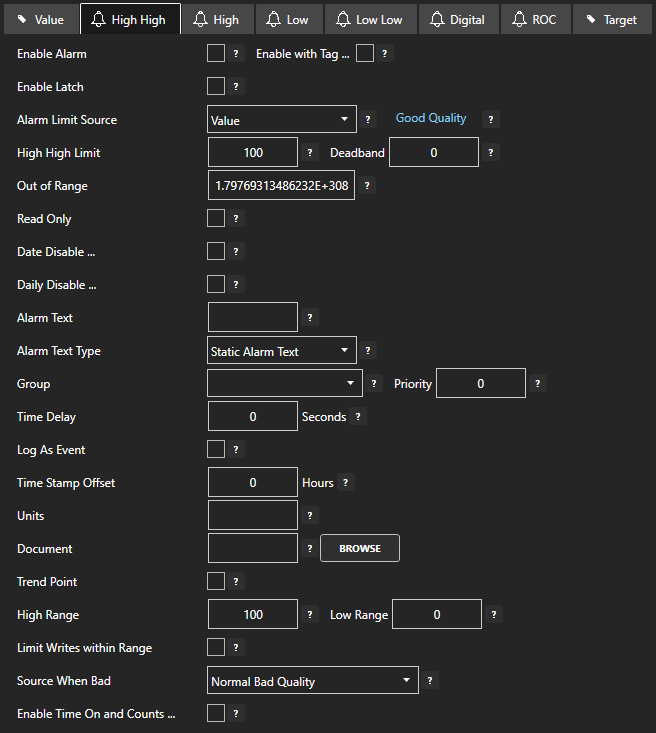
- Set your Alarm Limit Source with the dropdown box. If you choose Value, enter the value in the provided text field.
- When you have finished configuring your alarm limits, click Apply Changes in the bottom right of the properties window.
For More detailed instructions on Configuring Alarm Limits, visit our Alarm Limits tutorial or watch the video below:
Step 4. Configure Alarm Logging
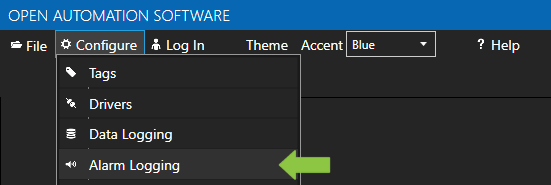
- In the OAS Configure Application, select Configure >> Alarm Logging from the top menu.
- Select localhost or the remote service you wish to log alarms from with the Select button to the right of the Network Node list.
- A Logging Group screen will appear.
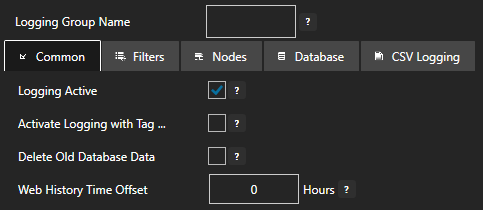
- In the Common tab, check the Logging Active checkbox to enable your group. Alternately, you can activate logging with a tag by checking that box.
- Use the Filters tab to select which alarms you wish to log with your group. Filtering can be done by alarm state, alarm limit, priority, groups and alarm type.
- In the Database tab, you will select what type of database you will be logging to and enter the connection parameters. OAS can log to SQL Server, Oracle, Access, PostgreSQL, Cassandra, MongoDB, MariaDB, SQLite, InfluxDB, and MySQL.
- If you wish to log to CSV, you would configure that in the CVS Logging tab.
- When you have finished configuring your logging group, click Add Group in the left panel to add your new group to the service.
For more detailed instructions on Configuring Alarm Logging, visit our Getting Started – Alarm Logging tutorial or watch the video below: