Unified IIoT Visualization Platform
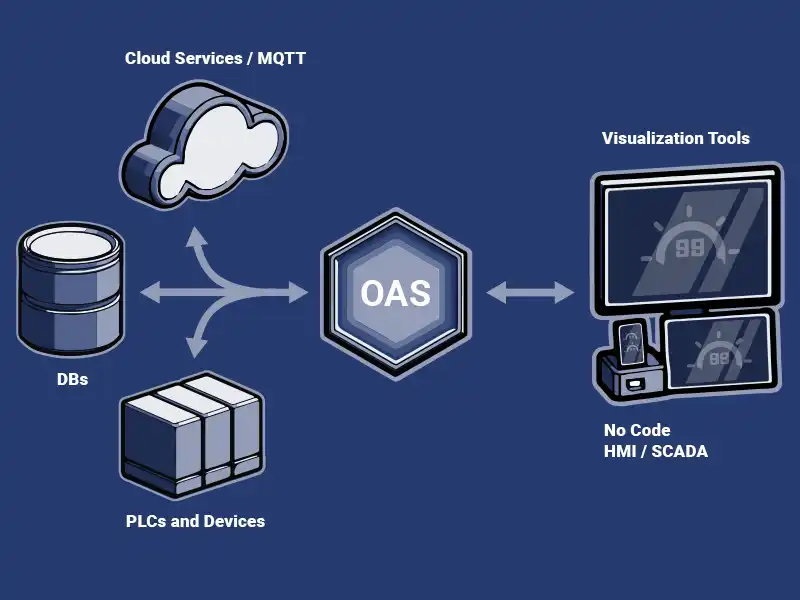
The OAS Platform includes a variety of IoT visualization tools making it easy to create user interfaces and HMIs for web applications, Windows PCs, and native apps for mobile devices.Designed for any browser and environment, our platform lets you visualize live and historical data, track Trends and Alarms across multiple devices.
a server-based, highly-scalable, network platform that enables the transport and transformation of your data
Data HistorianAchieve fault-tolerant logging, zero data loss, and multi-destination storage with our high-performance Store and Forward technology.
Visualization ToolsBuild Visualizations, User Interfaces, and server configuration interfaces for .NET, web technologies, native iOS and Android mobile apps
Device & Data ConnectorsThe OAS Platform provides rapid communications and connectivity to a wide variety of PLCs, devices, and databases.
IoT ConnectorsConnect to cloud-base IoT gateways such as AWS, Azure IoT Hub, Azure Event Hubs, Kafka, and more.
Alarm Logging & NotificationCapture events on each data point, log to open formats for historical analysis and archiving, and trigger real time notifications
SDKs & APIsExplore a wide variety of Developer Tools and APIs to allow you to create applications and system integrations to execute in any environment.
Networking FeaturesOpen Automation Software implements edge computing with a Distributed Network Architecture.
Download a fully functional trial of Open Automation SoftwareKey Features & Benefits
All of Your Data in Once Place
Data from any source connected to the OAS Platform can be accessed from any Visualization Tool and API. Mix data from different sources and protocols on one screen.
Access Data from Web Applications
Whether you use the Open UIEngine for no-code web app development, or direct integration with the WebHMI SDK, view live data in any browser on any device.
Access Data from Custom Native Apps
Use the .NET components or REST API to integrate live OAS data in any application, even native mobile apps or automated integrations.
Web Visualization Tools
Built upon the open standards of HTML5, CSS, and Javascript, OAS Web products can be utilized in any web application environment, and can be developed using your favorite IDE or code editors. Running applications can be viewed in any desktop or mobile browser.
Open UIEngine
Create complex applications within a web browser, and without writing a single line of code, all contained within the OAS server installation.
Web HMI
Develop web applications or integrate with existing web apps to display, modify, and control real time data in an OAS Service. Access it from any desktop or mobile browser for seamless, industrial IoT data visualization that keeps you in control wherever you are.
Web Trend
Create real time and historical Trend visualizations, plotting multiple simultaneous data points displayed in any desktop or mobile browser. It’s a great choice for those looking for log visualization tools to analyze and track data effortlessly.
Web Alarm
View and manage real time and historical Alarms. Interactive control allows users to acknowledge and comment on alarms, or filter based on any attribute.
.NET Visualization Tools
.NET Developers have access to visual controls for developing HMIs or User Interfaces in WinForms and WPF. Using the .NET Core Components of the .NET Data Connector, developers can create native iOS and Android apps using Xamarin Forms.
WinForm HMI .NET
Develop Windows Forms applications in .NET with C# or VB.NET., using a variety of visual controls to create IoT data visualization tools that deliver clear, real-time insights.
WPF HMI .NET
Develop visually stunning WPF applications in .NET using C# or VB.NET along with XAML. Includes a wide variety of visual controls.
Trend .NET
Create real time and historical Trend visualizations, plotting multiple simultaneous data points. Interactive visual controls for analyzing and exporting data.
Alarm .NET
View and manage real time and historical Alarms. Interactive control allows users to acknowledge and comment on alarms, or filter based on any attribute.
See How We Compare
The initial cost of OAS is far less than our competitors – but the savings don’t stop there. We work with OEMS and System Integrators to provide perpetual licenses with quantity discounts with flexible tag pricing and unlimited client connections.


