The following content will get you started with Web Trend, building your own web user interfaces with real time and historical data.
NOTE: If you want to visualize your data in a desktop or mobile browser with zero programming, you may be interested in the OAS Open UIEngine .
The UIEngine is a robust no-code web application and HMI builder for developing rich user interfaces in a browser-based development environment.
See the UIEngine Documentation to learn more.
For full reference information visit Programming Reference – Web Trend
Example 1: Simple Trend Data Integration
The following sample illustrates how to add real time animated charting to display a single server tag value as it changes over time. Later examples will show how to track multiple tags on a single chart, as well as how to add some interactivity and switching between real time and historical data.
Step 1:
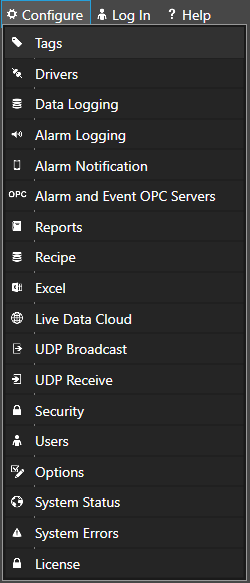
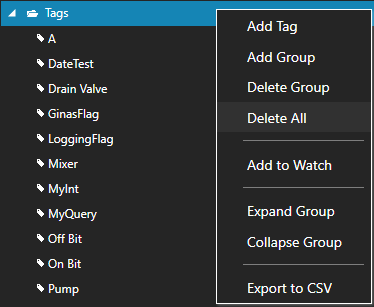
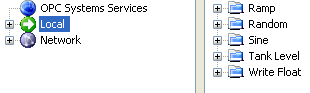
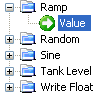
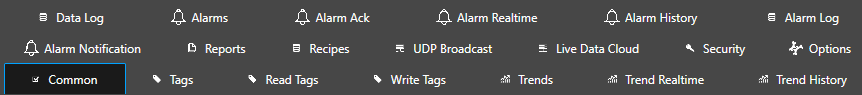
Important: In order to enable realtime trending of any Tag Value use the Configure OAS application and go to Configure-Tags to enable the Trend Point property on each Tag you want to trend.
You can also use the Tag CSV Export and Import with the column Value – Is Trend Point to enable multiple tags for trending in one step.
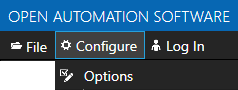
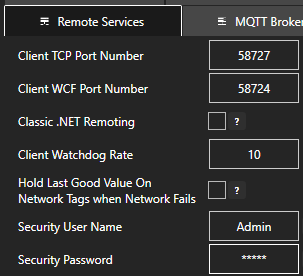
Configure Web Services within the OAS Platform. For instructions on how to accomplish this as well as optionally using SSL for secure communications, see the following article:
Configuring OAS Web Services
Step 2:
Be sure to follow instructions for configuring Web HMI as the Trend Data is an extension of that library.
In addition to the 3 previous script libraries (jQuery, json2, and opc-lib-min) copy 2 additional files from the same source location (C:\Program Files\Open Automation Software\OAS\HTML_HMIjs) to the same destination as the others, keeping the files within a flot directory:
- js/flot/jquery.flot.min.js
- js/flot/jquery.flot.time.min.js
Step 3:
In the head section of the HTML file, add the following script library references:
<script type="text/javascript" src="js/flot/jquery.flot.min.js"></script>
<script type="text/javascript" src="js/flot/jquery.flot.time.min.js"></script>
Once you have an HTML file set up and successfully running HTML HTML, modify the OAS_config script to look like the following:
OAS_config = {
    token:'7e61b230-481d-4551-b24b-ba9046e3d8f2',
    serverURL: 'http://localhost:58725/',
    trend_bindings:[
      {
        chartid:"trend1",
        samplerate: 1,
        timeframe: 100,
        tags:[
          {
            label: "Random",
            tag: "Random.Value",
            color: "#f00"
          }
        ],
        retain: 100,
        callback:trendCallback
      }
    ]
  };
Note: As with the Web HMI configuration, you must specify the serverURL that includes the Node Name and Port Number that has been registered by the OAS Service Control Manager.
Networking
If the OAS Tags reside on the same OAS Engine as the serverURL all tags can be defined as a local tag.
Local Tag
myGroup.myTag.Value
If the OAS Tags to trend are located on other remote nodes use the following network tag syntax to assign each pen.
Basic Networking
\\192.168.0.1\myGroup.myTag.Value
Live Data Cloud Networking from local OAS Engine
RemoteSCADAHosting.myLiveDataCloudNode.myGroup.myTag.Value
Live Data Cloud Networking though remote OAS Engine
\\192.168.0.1\RemoteSCADAHosting.myLiveDataCloudNode.myGroup.myTag.Value
Step 4:
Within the same script block containing the OAS_config, add the following function. This function will be responsible for rendering the data points returned by the server on each refresh call. As you can see, the name of the function trendCallback matches the value of callback defined in the OAS_config:
function trendCallback(data){
  // set up Flot options for formatting the x-axis
  options = {
    series: {
      lines: {
        show:true,
        fill:true
      }
    },
    xaxis: {
        mode: "time",
        tickSize: [2, "second"],
        tickFormatter: function (v, axis) {
          var dt = new Date(v);
          // display axis label every 30 seconds
            if (dt.getSeconds() % 30 == 0) {
              // format label to include date and time
              return OAS.Util.formatDate(dt,"mm/dd/yyyy hh:MM:ss nbsp;aa")
            }
            return "";
        }
    }
  }
  // locate the binding based on the inbound data
  tb = OAS.Trend.getTrendBinding(data);
  // format the data as a Flot series
  fd = OAS.Flot.buildTrendData(data);
  // call $.plot to draw the chart
  $.plot("#" + tb.chartid, fd, options);
}
In the body of your HTML, add an element where the chart will be drawn, using the following bit of HTML:
<div style="width:600px;height:300px;border:solid 1px #777;padding:20px;margin-bottom:20px;">
  <div id="trend1" style="width:600px;height:300px;"></div>
</div>
Note: The id of the div element is “trend1”, which matches the chartid configured in Step 3.
Save the HTML file and add it to your application in the same way as other Web HMI web pages. The complete file should look like the following:
<html>
<head>
<script type="text/javascript" src="js/lib/jquery-1.8.3.min.js"></script>
<script type="text/javascript" src="js/opc-lib-min.js"></script>
<script type="text/javascript" src="js/lib/json2.js"></script>
<script type="text/javascript" src="js/flot/jquery.flot.min.js"></script>
<script type="text/javascript" src="js/flot/jquery.flot.time.min.js"></script>
<link rel="stylesheet" stype="text/css" href="css/opc-style.css"/>
<script type="text/javascript">
OAS_config = {
token:'7e61b230-481d-4551-b24b-ba9046e3d8f2',
serverURL: 'http://localhost:58725/',
trend_bindings:[
{
chartid:"trend1",
samplerate: 1,
timeframe: 100,
tags:[
{
label: "Random",
tag: "Random.Value",
color: "#f00"
}
],
retain: 100,
callback:trendCallback
}
]
};
function trendCallback(data){
// set up Flot options for formatting the x-axis
options = {
series: {
lines: {
show:true,
fill:true
}
},
xaxis: {
mode: "time",
tickSize: [2, "second"],
tickFormatter: function (v, axis) {
var dt = new Date(v);
// display axis label every 30 seconds
if (dt.getSeconds() % 30 == 0) {
// format label to include date and time
return OAS.Util.formatDate(dt,"mm/dd/yyyy hh:MM:ss aa")
}
return "";
}
}
}
// locate the binding based on the inbound data
tb = OAS.Trend.getTrendBinding(data);
// format the data as a Flot series
fd = OAS.Flot.buildTrendData(data);
// call $.plot to draw the chart
$.plot("#" + tb.chartid, fd, options);
}
</script>
</head>
<body>
<div style="width:600px;height:300px;border:solid 1px #777;padding:20px;margin-bottom:20px;">
<div id="trend1" style="width:600px;height:300px;"></div>
</div>
</body>
</html>
Example 2: Multiple Real-Time Charts
The following sample builds upon Example 1, but illustrates how to add multiple real time animated charts to an application as well as adding multiple data sets to a single chart.
Step 1:
Be sure to follow instructions for configuring Web HMI as the Trend Data is an extension of that library.
In addition to the 3 previous script libraries (jQuery, json2, and opc-lib-min) copy 2 additional files from the same source location (C:\Program Files\Open Automation Software\OAS\HTML_HMI\js) to the same destination as the others, keeping the files within a flot directory:
- js/flot/jquery.flot.min.js
js/flot/jquery.flot.time.min.js
Also, please review Example 1 if any of the following steps are unclear.
Step 2:
In the head section of the HTML file, add the following script library references:
<script type="text/javascript" src="js/flot/jquery.flot.min.js"></script>
<script type="text/javascript" src="js/flot/jquery.flot.time.min.js"></script>
Step 3:
Once you have an HTML file set up and successfully running, modify the OAS_config script to look like the following. As you can see from this configuration, there are 2 trend_bindings in the array, with the first containing 2 tags.
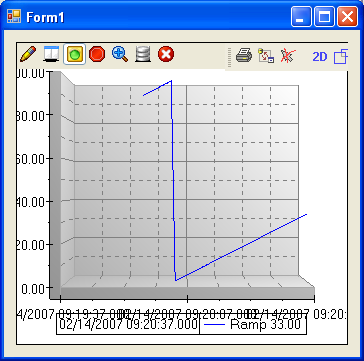
The first chart will display both data sets for the Ramp.Value and Random.Value server tags, and the second will display the Sine.Value tag.
OAS_config = {
    token:'7e61b230-481d-4551-b24b-ba9046e3d8f2',
    serverURL: 'http://localhost:58725/',
    trend_bindings:[
      {
        chartid:"trend1",
        samplerate: 1,
        timeframe: 100,
        tags:[
          {
            label:"Ramp",
            tag:"Ramp.Value",
            color:"#090"
          },
          {
            label: "Random",
            tag: "Random.Value",
            color: "#f00"
          }
        ],
        retain: 100,
        callback:trendCallback
      },
      {
        chartid:"trend2",
        samplerate: 1,
        timeframe: 100,
        tags:[
          {
            label: "Sine",
            tag: "Sine.Value",
            color: "#00c"
          }
        ],
        retain: 100,
        callback:trendCallback
      }
    ]
  };
Note: As with the Web HMI configuration, you must specify the serverURL that includes the Node Name and Port Number that has been registered by the OAS Service Control Manager.
Step 4:
Within the same script block containing the OAS_config, add the following function. This function will be responsible for rendering the data points reterned by the server on each refresh call.
As you can see, the name of the function trendCallback matches the value of callback defined in the OAS_config. Also, this is identical to the callback used in the first example. The single callback can be used to render any number of trend charts placed on the page.
function trendCallback(data){
  // set up Flot options for formatting the x-axis
  options = {
    series: {
      lines: {
        show:true,
        fill:true
      }
    },
    xaxis: {
      mode: "time",
      tickSize: [2, "second"],
      tickFormatter: function (v, axis) {
        var dt = new Date(v);
        // display axis label every 30 seconds
        if (dt.getSeconds() % 30 == 0) {
          // format label to include date and time
          return OAS.Util.formatDate(dt,"mm/dd/yyyy hh:MM:ss aa")
        }
        return "";
      }
    }
  }
  // locate the binding based on the inbound data
  tb = OAS.Trend.getTrendBinding(data);
  // format the data as a Flot series
  fd = OAS.Flot.buildTrendData(data);
  // call $.plot to draw the chart
  $.plot("#" + tb.chartid, fd, options);
}
Step 5:
In the body of your HTML, add an element for each trend chart to be drawn:
<div style="width:600px;height:300px;border:solid 1px #777;padding:20px;margin-bottom:20px;">
  <div id="trend1" style="width:600px;height:300px;"></div>
</div>
<div style="width:600px;height:300px;border:solid 1px #777;padding:20px;margin-bottom:20px;">
  <div id="trend2" style="width:600px;height:300px;"></div>
</div>
Note: The id of the div elements are “trend1” and “trend2“, respectively, which matches the chartid configured in Step 3 for each binding.
Step 6:
Save the HTML file and add it to your application in the same way as other Web HMI web pages. The complete file should look like the following:
<html>
<head>
<script type="text/javascript" src="js/lib/jquery-1.8.3.min.js"></script>
<script type="text/javascript" src="js/opc-lib-min.js"></script>
<script type="text/javascript" src="js/lib/json2.js"></script>
<script type="text/javascript" src="js/flot/jquery.flot.min.js"></script>
<script type="text/javascript" src="js/flot/jquery.flot.time.min.js"></script>
<link rel="stylesheet" stype="text/css" href="css/opc-style.css"/>
<script type="text/javascript">
OAS_config = {
token:'7e61b230-481d-4551-b24b-ba9046e3d8f2',
serverURL: 'http://localhost:58725/',
trend_bindings:[
{
chartid:"trend1",
samplerate: 1,
timeframe: 100,
tags:[
{
label:"Ramp",
tag:"Ramp.Value",
color:"#090"
},
{
label: "Random",
tag: "Random.Value",
color: "#f00"
}
],
retain: 100,
callback:trendCallback
},
{
chartid:"trend2",
samplerate: 1,
timeframe: 100,
tags:[
{
label: "Sine",
tag: "Sine.Value",
color: "#00c"
}
],
retain: 100,
callback:trendCallback
}
]
};
function trendCallback(data){
// set up Flot options for formatting the x-axis
options = {
series: {
lines: {
show:true,
fill:true
}
},
xaxis: {
mode: "time",
tickSize: [2, "second"],
tickFormatter: function (v, axis) {
var dt = new Date(v);
// display axis label every 30 seconds
if (dt.getSeconds() % 30 == 0) {
// format label to include date and time
return OAS.Util.formatDate(dt,"mm/dd/yyyy hh:MM:ss aa")
}
return "";
}
}
}
// locate the binding based on the inbound data
tb = OAS.Trend.getTrendBinding(data);
// format the data as a Flot series
fd = OAS.Flot.buildTrendData(data);
// call $.plot to draw the chart
$.plot("#" + tb.chartid, fd, options);
}
</script>
</head>
<body>
<div style="width:600px;height:300px;border:solid 1px #777;padding:20px;margin-bottom:20px;">
<div id="trend1" style="width:600px;height:300px;"></div>
</div>
<div style="width:600px;height:300px;border:solid 1px #777;padding:20px;margin-bottom:20px;">
<div id="trend2" style="width:600px;height:300px;"></div>
</div>
</body>
</html>
Example 3: Interactive Charts
The following sample illustrates how you can add interactivity to your charts, by rendering a cursor that follows the mouse position, a popup that displays the chart value at the location where the mouse hovers, and even temporarily pauses the real time rendering when a value is displayed.
Step 1:
Be sure to follow instructions for configuring Web HMI as the Trend Data is an extension of that library.
In addition to the 3 previous script libraries (jQuery, json2, and opc-lib-min) copy 3 additional files from the same source location (C:\Program Files\Open Automation Software\OAS\HTML_HMIjs) to the same destination as the others, keeping the files within a flot directory:
- js/flot/jquery.flot.min.js
- js/flot/jquery.flot.time.min.js
- js/flot/jquery.flot.crosshair.min.js
Also, please review Examples 1 and 2 if any of the following steps are unclear.
Step 2:
In the head section of the HTML file, add the following script library references:
<script type="text/javascript" src="js/flot/jquery.flot.min.js"></script>
<script type="text/javascript" src="js/flot/jquery.flot.time.min.js"></script>
<script type="text/javascript" src="js/flot/jquery.flot.crosshair.min.js"></script>
Step 3:
In the head section of the HTML file, add the following CSS style definitions that will be used to format the chart and popup elements:
<style type="text/css">
    .container {
      width:600px;height:300px;
    }
    .outer-container {
      width:600px;height:300px;
      border:solid 1px #666;
      padding:20px;
    }
    body {
      padding:40px;
      background-color:#fff;
    }
    #tooltip {
      position:absolute;
      z-index:9999;
      border:2px solid #fff;
      padding:2px;
      background-color:#666;
      color:#fff;
      box-shadow:2px 2px 2px 0px rgba(0,0,0,0.2);
    }
  </style>
Step 4:
Once you have an HTML file set up and successfully running, modify the OAS_config script to look like the following.
OAS_config = {
    token:'7e61b230-481d-4551-b24b-ba9046e3d8f2',
    serverURL: 'http://localhost:58725/',
    trend_bindings:[
      {
        chartid:"trend1",
        samplerate: 1,
        timeframe: 100,
        tags:[
          {
            label: "Sine",
            tag: "Sine.Value",
            color: "#66c"
          }
        ],
        retain: 100,
        callback:trendCallback
      }
    ]
  };
Note: As with the Web HMI configuration, you must specify the serverURL that includes the Node Name and Port Number that has been registered by the OAS Service Control Manager.
Step 5:
Within the same script block containing the OAS_config, add the following functions. These will control showing and hiding the popup that will display the chart value where the cursor is hovering.
// hide the tooltip element
function hideToolTip(){
$("#tooltip").hide();
}
// show tooltip on demand
function showToolTip(item){
hideToolTip();
tt = $("#tooltip")
if (tt.length == 0) {
// create tooltip element if it doesn't exist
tt = $("<div id='tooltip'></div>")
$("body").append(tt)
tt.hide();
}
$("#tooltip").css("background-color",item.series.color);
var x = item.datapoint[0].toFixed(2);
var dt = new Date(parseInt(x));
var dtf = OAS.Util.formatDate(dt,"hh:MM:ss aa");
var y = item.datapoint[1].toFixed(2);
$("#tooltip").html(dtf + " = " + y).css({
top: item.pageY + 5,
left: item.pageX + 5
}).fadeIn(200);
}
Step 6:
Also within the script block, add the following call that will bind the mouse hover events to the chart elements.
// set up event handler for displaying tooltip on hover
$(document).ready(function(){
  // 'plothover' event is fired by Flot when mouse hovers over
  //  any plot points on the chart
  $("#trend1").bind("plothover", function (event, pos, item) {
    // item represents the plot point
    if (item) {
      if (previousPoint != item.dataIndex) {
        previousPoint = item.dataIndex;
        showToolTip(item)
        // stop the OAS Trend data calls to the server
        if (OAS.is_refreshing()) OAS.toggle_refresh(false);
      }
    } else {
      // restart refreshes
      if (!OAS.is_refreshing()) OAS.toggle_refresh(true);
      hideToolTip();
      previousPoint = null;
    }
  });
});
Step 7:
The final function added to the scripts should be the trendCallback. As with other examples, this is the function executed ever time new data points are received from the OAS Server.
This also demonstrates how the grid is configured to listen to hover and click events, and how the crosshair is added to make it easier to see when the mouse hovers over it.
function trendCallback(data) {
  // locate the binding based on the inbound data
  tb = OAS.Trend.getTrendBinding(data);

  // set up Flot options for formatting the x-axis
  options = {
    series: {
      lines: {
        show:true,
        fill:true
      }
    },
    grid: { hoverable: true, clickable: true },
    crosshair: { mode: "x"},
    xaxis: {
        mode: "time",
        tickSize: [2, "second"],
        tickFormatter: function (v, axis) {
          var dt = new Date(v);
          if (tb.mode == "trend" && dt.getSeconds() % 30 == 0) {
              return OAS.Util.formatDate(dt,"mm/dd/yyyy hh:MM:ss aa")
          }
            return "";
        }
    }
  }

  // format the data as a Flot series
  fd = OAS.Flot.buildTrendData(data);
  // call $.plot to draw the chart
  $.plot("#" + tb.chartid, fd, options);
}
Step 8:
In the body of your HTML, add an element where the chart will be drawn:
<div id="trendContainer" class="outer-container">
  <div id="trend1" class="container"></div>
</div>
Step 9:
Save the HTML file and add it to your application in the same way as other Web HMI web pages. The complete file should look like the following:
<html>
<head>
<script type="text/javascript" src="js/lib/jquery-1.8.3.min.js"></script>
<script type="text/javascript" src="js/opc-lib-min.js"></script>
<script type="text/javascript" src="js/lib/json2.js"></script>
<script type="text/javascript" src="js/flot/jquery.flot.min.js"></script>
<script type="text/javascript" src="js/flot/jquery.flot.time.min.js"></script>
<script type="text/javascript" src="js/flot/jquery.flot.crosshair.min.js"></script>
<link rel="stylesheet" stype="text/css" href="css/opc-style.css"/>
<style type="text/css">
    .container {
      width:600px;height:300px;
    }
    .outer-container {
      width:600px;height:300px;
      border:solid 1px #666;
      padding:20px;
    }
    body {
      padding:40px;
      background-color:#fff;
    }
    #tooltip {
      position:absolute;
      z-index:9999;
      border:2px solid #fff;
      padding:2px;
      background-color:#666;
      color:#fff;
      box-shadow:2px 2px 2px 0px rgba(0,0,0,0.2);
    }
  </style>
<script type="text/javascript">
OAS_config = {
    token:'7e61b230-481d-4551-b24b-ba9046e3d8f2',
    serverURL: 'http://localhost:58725/',
    trend_bindings:[
      {
        chartid:"trend1",
        samplerate: 1,
        timeframe: 100,
        tags:[
          {
            label: "Sine",
            tag: "Sine.Value",
            color: "#66c"
          }
        ],
        retain: 100,
        callback:trendCallback
      }
    ]
  };
// hide the tooltip element
function hideToolTip(){
$("#tooltip").hide();
}
// show tooltip on demand
function showToolTip(item){
hideToolTip();
tt = $("#tooltip")
if (tt.length == 0) {
// create tooltip element if it doesn't exist
tt = $("<div id='tooltip'></div>")
$("body").append(tt)
tt.hide();
}
$("#tooltip").css("background-color",item.series.color);
var x = item.datapoint[0].toFixed(2);
var dt = new Date(parseInt(x));
var dtf = OAS.Util.formatDate(dt,"hh:MM:ss aa");
var y = item.datapoint[1].toFixed(2);
$("#tooltip").html(dtf + " = " + y).css({
top: item.pageY + 5,
left: item.pageX + 5
}).fadeIn(200);
}
// set up event handler for displaying tooltip on hover
$(document).ready(function(){
// 'plothover' event is fired by Flot when mouse hovers over
// any plot points on the chart
$("#trend1").bind("plothover", function (event, pos, item) {
// item represents the plot point
if (item) {
if (previousPoint != item.dataIndex) {
previousPoint = item.dataIndex;
showToolTip(item)
// stop the OAS Trend data calls to the server
if (OAS.is_refreshing()) OAS.toggle_refresh(false);
}
} else {
// restart refreshes
if (!OAS.is_refreshing()) OAS.toggle_refresh(true);
hideToolTip();
previousPoint = null;
}
});
});
function trendCallback(data) {
// locate the binding based on the inbound data
tb = OAS.Trend.getTrendBinding(data);
// set up Flot options for formatting the x-axis
options = {
series: {
lines: {
show:true,
fill:true
}
},
grid: { hoverable: true, clickable: true },
crosshair: { mode: "x"},
xaxis: {
mode: "time",
tickSize: [2, "second"],
tickFormatter: function (v, axis) {
var dt = new Date(v);
if (tb.mode == "trend1" && dt.getSeconds() % 30 == 0) {
return OAS.Util.formatDate(dt,"mm/dd/yyyy hh:MM:ss aa")
}
return "";
}
}
}
// format the data as a Flot series
fd = OAS.Flot.buildTrendData(data);
// call $.plot to draw the chart
$.plot("#" + tb.chartid, fd, options);
}
</script>
</head>
<body>
<div id="trendContainer" class="outer-container">
<div id="trend1" class="container"></div>
</div>
</body>
</html>
Example 4: Historical Data
The following sample illustrates how you can switch a chart between real time and historical data modes, with the historical data being a snapshot of all data points between a start and end date/time.
Step 1:
Be sure to follow instructions for configuring Web HMI as the Trend Data is an extension of that library.
In addition to the 3 previous script libraries (jquery, json2, and opc-lib-min) copy 3 additional files from the same source location (C:\Program Files\Open Automation Software\OAS\HTML_HMIjs) to the same destination as the others, keeping the files within a flot directory:
- js/flot/jquery.flot.min.js
- js/flot/jquery.flot.time.min.js
- js/flot/jquery.flot.crosshair.min.js
Also, please review Examples 1 and 2 if any of the following steps are unclear.
Step 2:
In the head section of the HTML file, add the following script library references:
<script type="text/javascript" src="js/flot/jquery.flot.min.js"></script>
<script type="text/javascript" src="js/flot/jquery.flot.time.min.js"></script>
<script type="text/javascript" src="js/flot/jquery.flot.crosshair.min.js"></script>
Step 3:
In the head section of the HTML file, add the following CSS style definitions that will be used to format the chart and popup elements:
<style type="text/css">
.container {
width:600px;height:300px;
}
.outer-container {
width:600px;height:300px;
border:solid 1px #666;
padding:20px;
}
body {
padding:40px;
background-color:#fff;
}
#tooltip {
position:absolute;
z-index:9999;
border:2px solid #fff;
padding:2px;
background-color:#666;
color:#fff;
box-shadow:2px 2px 2px 0px rgba(0,0,0,0.2);
}
</style>
Step 4:
Once you have an HTML file set up and successfully running, modify the OAS_config script to look like the following.
OAS_config = {
token:'7e61b230-481d-4551-b24b-ba9046e3d8f2',
serverURL: 'http://localhost:58725/',
trend_bindings:[
{
chartid:"trend1",
samplerate: 1,
timeframe: 100,
tags:[
{
label: "Sine",
tag: "Sine.Value",
color: "#66c"
}
],
retain: 100,
callback:trendCallback
}
]
};
Note: As with the Web HMI configuration, you must specify the serverURL that includes the Node Name and Port Number that has been registered by the OAS Service Control Manager.
Step 5:
Within the same script block containing the OAS_config, add the following functions. These will control showing and hiding the popup that will display the chart value where the cursor is hovering, as well as functions for showing ins hiding axes when historical data is being displayed.
There is also a simple utility function used to validate the values entered into the text boxes on the page, ensuring that they are valid dates.
// hide the tooltip element
function hideToolTip(){
$("#tooltip").hide();
}
// show tooltip on demand
function showToolTip(item){
hideToolTip();
tt = $("#tooltip")
if (tt.length == 0) {
// create tooltip element if it doesn't exist
tt = $("<div id='tooltip'></div>")
$("body").append(tt)
tt.hide();
}
$("#tooltip").css("background-color",item.series.color);
var x = item.datapoint[0].toFixed(2);
var dt = new Date(parseInt(x));
var dtf = OAS.Util.formatDate(dt,"hh:MM:ss aa");
var y = item.datapoint[1].toFixed(2);
$("#tooltip").html(dtf + " = " + y).css({
top: item.pageY + 5,
left: item.pageX + 5
}).fadeIn(200);
}
// display history axes for just start and end time since
// data points may be spread over a long period of time
function setHistoryAxes(data){
$("#trendContainer").append($("<div id='historyAxes'></div>"));
sd = $("<div style='float:left;'>" + OAS.Util.formatDate(data.firsttime, "mm/dd/yyyy<br/>hh:MM:ss aa") + "</div>");
ed = $("<div style='float:right;'>" + OAS.Util.formatDate(data.lasttime, "mm/dd/yyyy<br/>hh:MM:ss aa") + "</div>");
$("#historyAxes").append(sd);
$("#historyAxes").append(ed);
$("#historyAxes").append($("<div stye='clear:both;'></div>"));
}
function clearHistoryAxes(){
$("#historyAxes").remove();
}
function validDate(d) {
if ( Object.prototype.toString.call(d) === "[object Date]" ) {
if ( !isNaN( d.getTime() ) ) {
return true;
}
}
return false;
}
Step 6:
Also within the script block, add the following call that will bind the mouse hover events to the chart elements and the click events for the buttons on the page.
// set up event handler for displaying tooltip on hover
$(document).ready(function(){
  // 'plothover' event is fired by Flot when mouse hovers over
  //  any plot points on the chart
  $("#trend1").bind("plothover", function (event, pos, item) {
    // item represents the plot point
    if (item) {
      if (previousPoint != item.dataIndex) {
        previousPoint = item.dataIndex;
        showToolTip(item)
        // stop the OAS Trend data calls to the server
        if (OAS.is_refreshing()) OAS.toggle_refresh(false);
      }
    } else {
      // restart refreshes
      if (!OAS.is_refreshing()) OAS.toggle_refresh(true);
      hideToolTip();
      previousPoint = null;
    }
  });
  $("#showHistory").click(function(){
    try {
      dts = new Date($("#startDate").val())
      dte = new Date($("#endDate").val())
      if (validDate(dts) && validDate(dte)){
        OAS.Trend.getHistoryData("trend1",dts,dte);
        $(this).attr("disabled",true);
        $("#resumeTrend").attr("disabled",false);
      }
    }
    catch(err) {
      alert(err.message);
    }
  });
  $("#resumeTrend").click(function(){
    OAS.Trend.resumeTrendData("trend1");
    $(this).attr("disabled",true);
    $("#showHistory").attr("disabled",false);
  });
});
Step 7:
The final function added to the scripts should be the trendCallback. As with other examples, this is the function executed ever time new data points are received from the OAS Server.
This also demonstrates how the grid is configured to listen to hover and click events, and how the crosshair is added to make it easier to see when the mouse hovers over it.
function trendCallback(data) {
  // locate the binding based on the inbound data
  tb = OAS.Trend.getTrendBinding(data);

  // set up Flot options for formatting the x-axis
  options = {
    series: {
      lines: {
        show:true,
        fill:true
      }
    },
    grid: { hoverable: true, clickable: true },
    crosshair: { mode: "x"},
    xaxis: {
        mode: "time",
        tickSize: [2, "second"],
        tickFormatter: function (v, axis) {
          var dt = new Date(v);
          if (tb.mode == "trend" && dt.getSeconds() % 30 == 0) {
              return OAS.Util.formatDate(dt,"mm/dd/yyyy hh:MM:ss aa")
          }
            return "";
        }
    }
  }

  // format the data as a Flot series
  fd = OAS.Flot.buildTrendData(data);
  // call $.plot to draw the chart
  $.plot("#" + tb.chartid, fd, options);
}
Step 8:
In the body of your HTML, add an element where the chart will be drawn:
<div id="trendContainer" class="outer-container">
  <div id="trend1" class="container"></div>
</div>
<div style="margin-top:30px;">
  <input type="button" id="showHistory" value="SHOW HISTORY"></input>
  start date: <input type="text" id="startDate"></input>
  end date: <input type="text" id="endDate"></input>
  <br/>
  <input type="button" id="resumeTrend" value="RESUME TREND" disabled="disabled"></input>
</div>
Step 9:
Save the HTML file and add it to your application in the same way as other Web HMI web pages. The complete file should look like the following:
<html>
<head>
<script type="text/javascript" src="js/lib/jquery-1.8.3.min.js"></script>
<script type="text/javascript" src="js/opc-lib-min.js"></script>
<script type="text/javascript" src="js/lib/json2.js"></script>
<script type="text/javascript" src="js/flot/jquery.flot.min.js"></script>
<script type="text/javascript" src="js/flot/jquery.flot.time.min.js"></script>
<script type="text/javascript" src="js/flot/jquery.flot.crosshair.min.js"></script>
<link rel="stylesheet" stype="text/css" href="css/opc-style.css"/>
<style type="text/css">
.container {
width:600px;height:300px;
}
.outer-container {
width:600px;height:330px;
border:solid 1px #666;
padding:20px;
}
body {
padding:40px;
background-color:#fff;
}
#tooltip {
position:absolute;
z-index:9999;
border:2px solid #fff;
padding:2px;
background-color:#666;
color:#fff;
box-shadow:2px 2px 2px 0px rgba(0,0,0,0.2);
}
#historyAxes {
font-size:12px;
padding-left:25px;
}
input[type=button] {
border:solid 1px #ccc;
font-weight:bold;
padding:5px 20px;
}
</style>
<script type="text/javascript">
OAS_config = {
token:'7e61b230-481d-4551-b24b-ba9046e3d8f2',
serverURL: 'http://localhost:58725/',
trend_bindings:[
{
chartid:"trend1",
samplerate: 1,
timeframe: 100,
tags:[
{
label: "Sine",
tag: "Sine.Value",
color: "#66c"
}
],
retain: 100,
callback:trendCallback
}
]
};
// hide the tooltip element
function hideToolTip(){
$("#tooltip").hide();
}
// show tooltip on demand
function showToolTip(item){
hideToolTip();
tt = $("#tooltip")
if (tt.length == 0) {
// create tooltip element if it doesn't exist
tt = $("<div id='tooltip'></div>")
$("body").append(tt)
tt.hide();
}
$("#tooltip").css("background-color",item.series.color);
var x = item.datapoint[0].toFixed(2);
var dt = new Date(parseInt(x));
var dtf = OAS.Util.formatDate(dt,"hh:MM:ss aa");
var y = item.datapoint[1].toFixed(2);
$("#tooltip").html(dtf + " = " + y).css({
top: item.pageY + 5,
left: item.pageX + 5
}).fadeIn(200);
}
// display history axes for just start and end time since
// data points may be spread over a long period of time
function setHistoryAxes(data){
$("#trendContainer").append($("<div id='historyAxes'></div>"));
sd = $("<div style='float:left;'>" + OAS.Util.formatDate(data.firsttime, "mm/dd/yyyy<br/>hh:MM:ss aa") + "</div>");
ed = $("<div style='float:right;'>" + OAS.Util.formatDate(data.lasttime, "mm/dd/yyyy<br/>hh:MM:ss aa") + "</div>");
$("#historyAxes").append(sd);
$("#historyAxes").append(ed);
$("#historyAxes").append($("<div stye='clear:both;'></div>"));
}
function clearHistoryAxes(){
$("#historyAxes").remove();
}
function validDate(d) {
if ( Object.prototype.toString.call(d) === "[object Date]" ) {
if ( !isNaN( d.getTime() ) ) {
return true;
}
}
return false;
}
// set up event handler for displaying tooltip on hover
$(document).ready(function(){
// 'plothover' event is fired by Flot when mouse hovers over
// any plot points on the chart
$("#trend1").bind("plothover", function (event, pos, item) {
// item represents the plot point
if (item) {
if (previousPoint != item.dataIndex) {
previousPoint = item.dataIndex;
showToolTip(item)
// stop the OAS Trend data calls to the server
if (OAS.is_refreshing()) OAS.toggle_refresh(false);
}
} else {
// restart refreshes
if (!OAS.is_refreshing()) OAS.toggle_refresh(true);
hideToolTip();
previousPoint = null;
}
});
$("#showHistory").click(function(){
try {
dts = new Date($("#startDate").val())
dte = new Date($("#endDate").val())
if (validDate(dts) && validDate(dte)){
OAS.Trend.getHistoryData("trend1",dts,dte);
$(this).attr("disabled",true);
$("#resumeTrend").attr("disabled",false);
}
}
catch(err) {
alert(err.message);
}
});
$("#resumeTrend").click(function(){
OAS.Trend.resumeTrendData("trend1");
$(this).attr("disabled",true);
$("#showHistory").attr("disabled",false);
});
});
function trendCallback(data) {
// locate the binding based on the inbound data
tb = OAS.Trend.getTrendBinding(data);
// set up Flot options for formatting the x-axis
options = {
series: {
lines: {
show:true,
fill:true
}
},
grid: { hoverable: true, clickable: true },
crosshair: { mode: "x"},
xaxis: {
mode: "time",
tickSize: [2, "second"],
tickFormatter: function (v, axis) {
var dt = new Date(v);
if (tb.mode == "trend" && dt.getSeconds() % 30 == 0) {
return OAS.Util.formatDate(dt,"mm/dd/yyyy hh:MM:ss aa")
}
return "";
}
}
}
// format the data as a Flot series
fd = OAS.Flot.buildTrendData(data);
// call $.plot to draw the chart
$.plot("#" + tb.chartid, fd, options);
}
</script>
</head>
<body>
<div id="trendContainer" class="outer-container">
<div id="trend1" class="container"></div>
</div>
<div style="margin-top:30px;">
<input type="button" id="showHistory" value="SHOW HISTORY"></input>
start date: <input type="text" id="startDate"></input>
end date: <input type="text" id="endDate"></input>
<br/>
<input type="button" id="resumeTrend" value="RESUME TREND" disabled="disabled"></input>
</div>
</body>
</html>


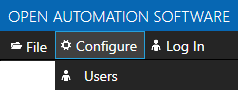


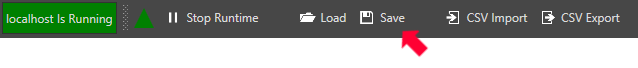
 Start Configure OAS application if it is not already running.