Last updated: 19 November 2025
At Open Automation Software (OAS), we believe great software deserves great support. We know our platform is often used in complex, mission-critical environments, and we strive to be a helpful partner every step of the way. This Support & Maintenance Policy explains what you can expect from us when you have an active Maintenance plan and how we can work together for the best possible outcome.
Open Automation Software reserves the right to modify this support policy at any time.
A Partnership for Success
Deploying automation solutions often involves many moving parts — networks, databases, control systems, cloud services, and more. OAS understands how challenging and dynamic these environments can be. That’s why we are committed to being responsive, collaborative, and customer-oriented whenever you need assistance.
We do not impose hard limits on how many support questions you can create or the amount of time we will spend to help you. However, support staff are a limited resource, and we must therefore work together to ensure that we have the relevant information, expertise and system access available on the customer side.
Our support team handles a wide range of questions — from installation help to advanced data architecture conversations. We love to help, but support is not a replacement for hands-on training, consulting services, or custom solution development.
What Active Maintenance Includes
Every new license includes a complimentary 90-day support period. From there, a 12-month Maintenance begins and must remain active to continue receiving priority support, updates, and licensing flexibility.
OAS provides a single maintenance plan at a cost of 20% of the purchase price. If Maintenance lapses the OAS software will continue to operate, however reinstatement fees or updated terms may apply before service resumes.
With active Maintenance, customers receive:
- Updates and patches to ensure you stay current and secure
- Technical support for troubleshooting and product usage
- Flexibility to adjust licenses as projects evolve — including changing the number of Tags, adding or removing features, moving a license to another server and reallocating flex Tags between servers
- Price protection for the duration of your maintenance term
We’re here to help you get long-term value from your investment in OAS.
Reinstating Maintenance
If Maintenance has lapsed and you wish to get back onto maintenance, please provide license code from existing license(s), email license code to sales@oasiot.com and the Sales team will get back to you with a quote.
Support Availability
Support is available 24 hours a day, 7 days a week. You can contact us any time through our support@oasiot.com email address. We do our best to respond to every request as quickly as possible, but response times may vary due to time zone and weekend coverage.
No matter the situation, our goal is always to get you moving forward smoothly.
How We Prioritize Requests
We categorize support requests into two types:
- Issues — faults or malfunctions preventing expected operation
- Questions — guidance on product use or capabilities
We then prioritize based on impact:
- Production issues affecting live operations
- Non-production issues and faults
- Troubleshooting and configuration assistance
- General questions and requests about features or capabilities
Working Together
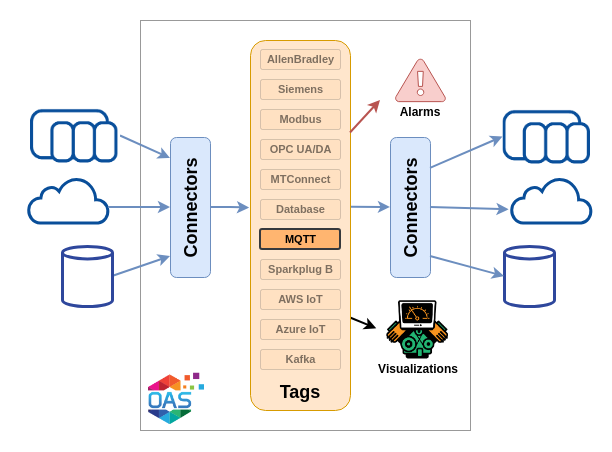
Since OAS runs inside your infrastructure, both sides have a role to play in successful operation and problem-solving:
- Your team maintains and supports the external environment — like operating systems, networking, databases, devices, and cloud services
- OAS focuses on helping you configure and troubleshoot our software at the integration points
We will always make our best effort to evaluate issues, help you understand interaction points, and guide you toward a resolution — even where other systems are involved. However, OAS cannot take responsibility for infrastructure we don’t manage.
We rely on your experts to provide timely and accurate information such as logs, screenshots, configuration details, and test results so we can identify the root cause as efficiently as possible.
Fixing Software Defects and Improving OAS
If you discover a software defect, we want to hear about it. After confirming the issue, we will:
- Assign it an appropriate priority
- Gather information and try to reproduce the issue with your assistance
- Work on a fix, patch, or improvement
- Keep you informed on progress and timelines
Due to the unique nature of every system and solution, we may ask you for additional information such as OAS configuration, screenshots, sample data, version and integration with external systems. Often, we will also need your assistance to deploy and test new versions to ensure your problem has been resolved.
If you believe OAS could be improved, we also appreciate ideas for enhancements, and new feature requests which are then reviewed on a case-by-case basis.
Self-Service Resources
Sometimes the fastest answer is already available. We have extensive information available on our website where you can learn more about OAS.
Our website includes:
These resources are constantly growing based on real-world customer needs and feedback.