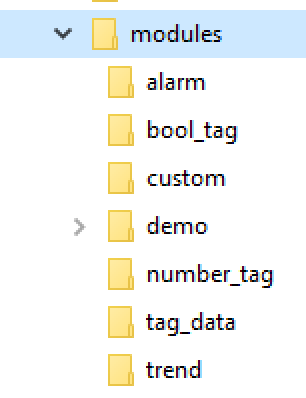
Modules are each self-contained, and files relative to each can be found in the installation directory under the modules folder.
At a minimum, under each module folder you fill find a module.js file and a style.css file. The module.js file is the core module executable, and the style.css contains specific stylesheet rules used by the module. Some modules may contain other assets, such as the Demo Module.
Removing Modules
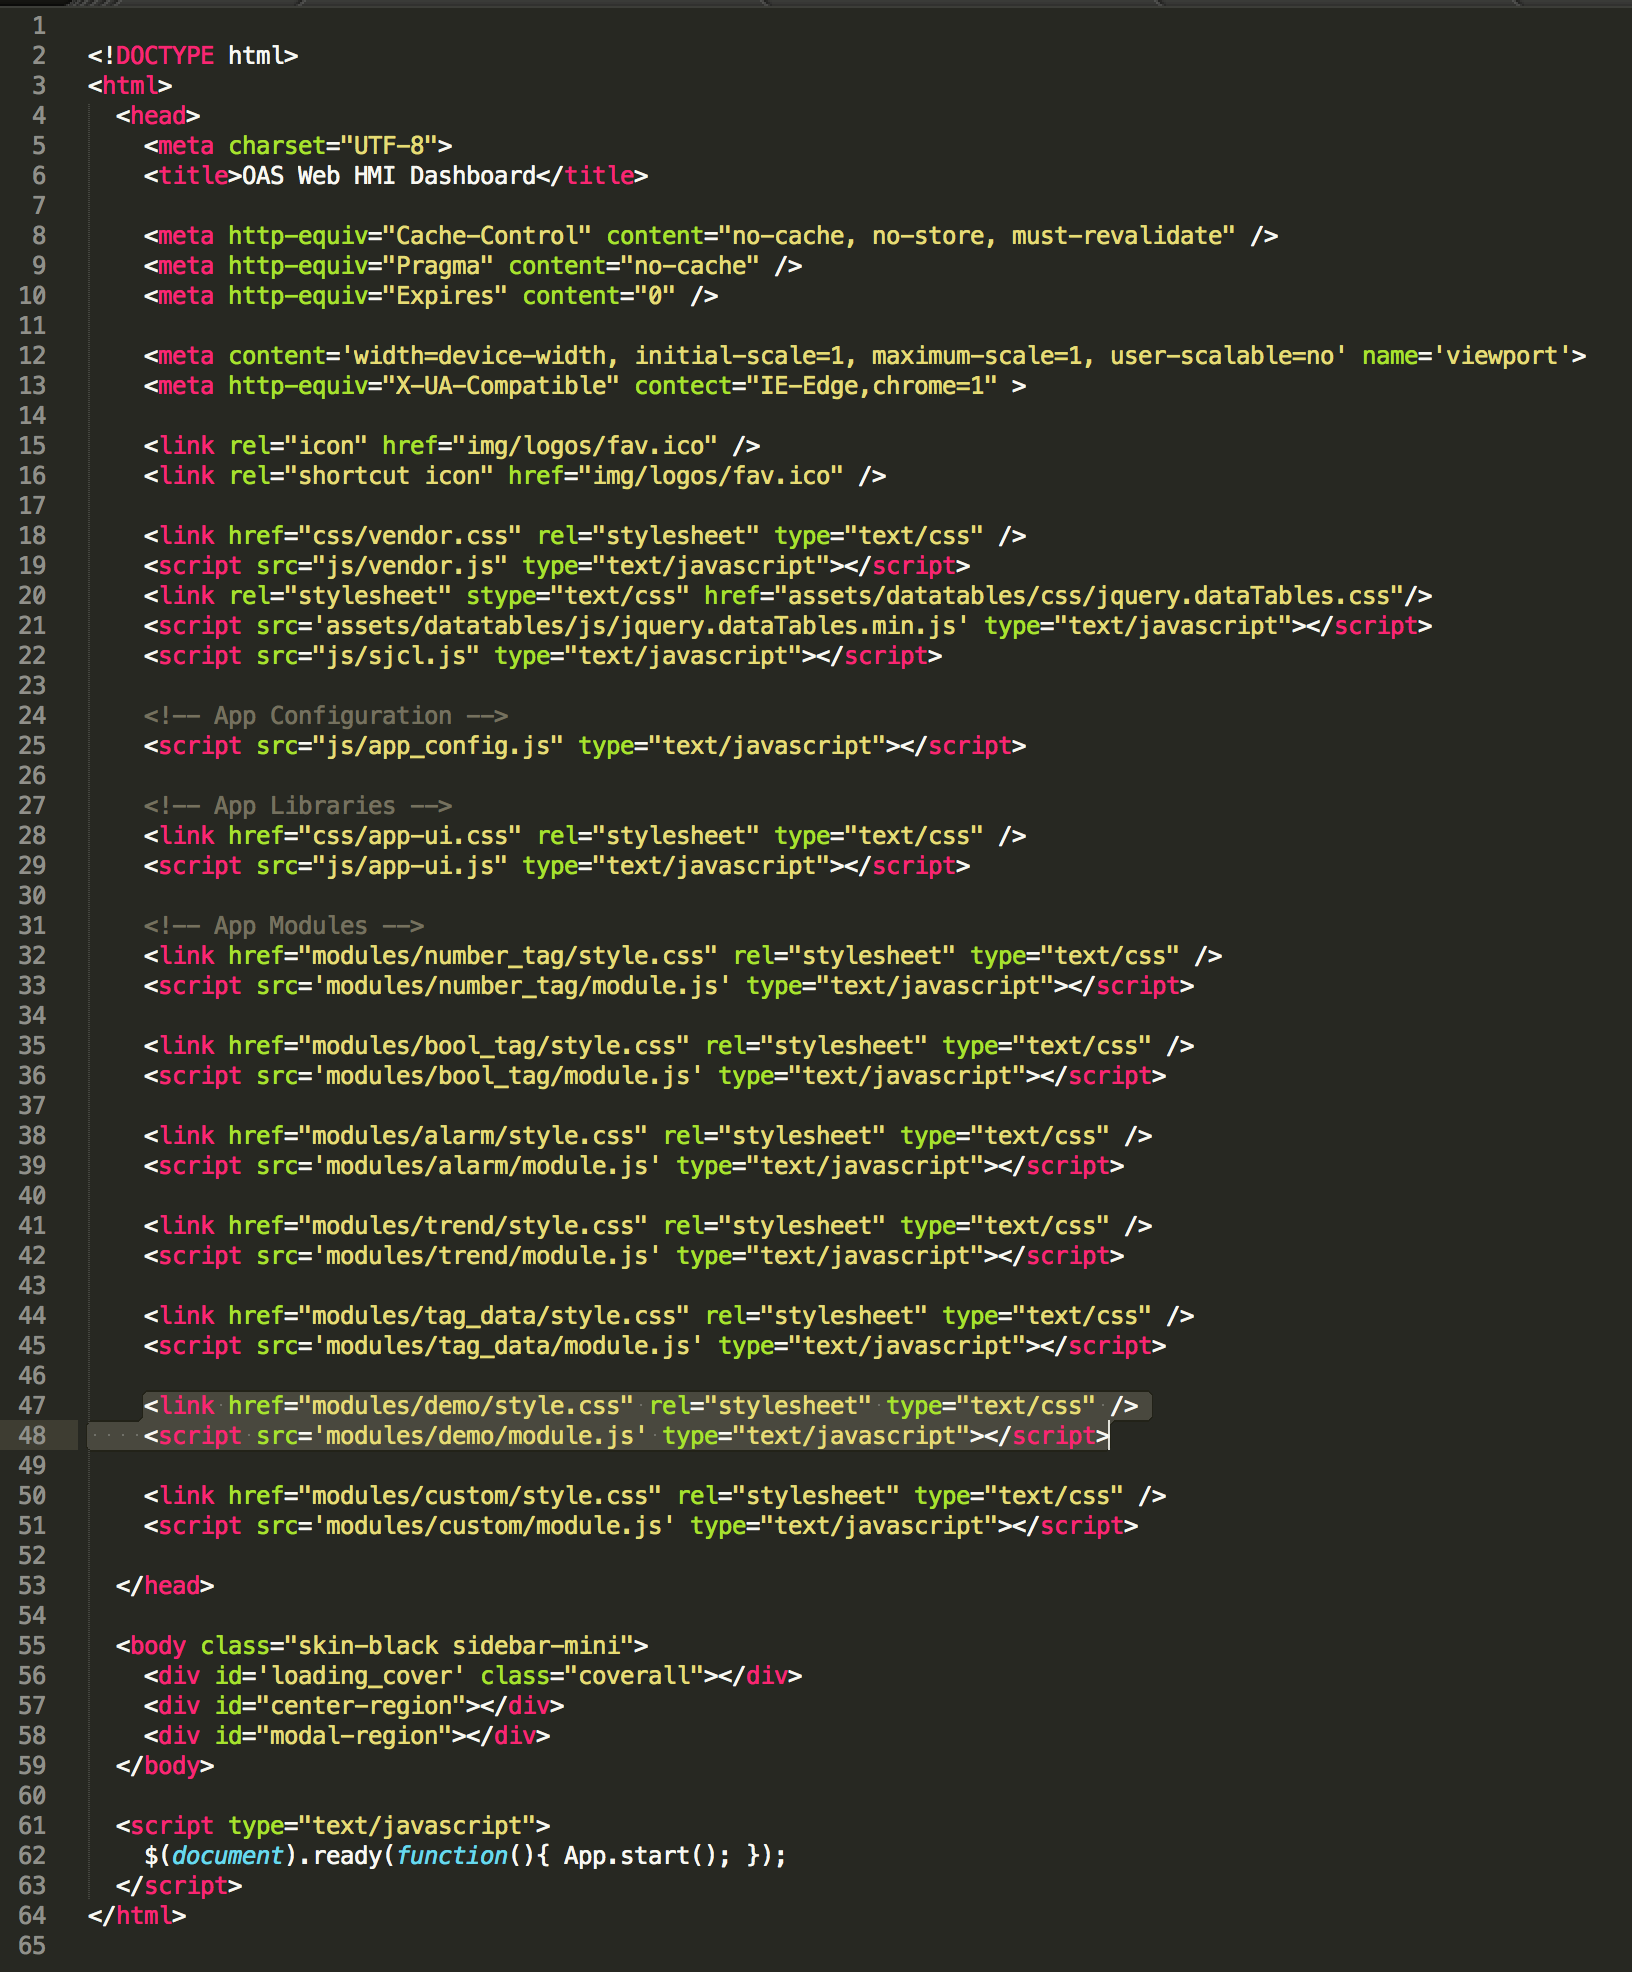
To remove a module from the application, you simply need to remove the reference to the module script and stylesheet within the index.html file. These references are found in the <head> element of the index.html file. Once you remove these references, the module will no longer appear in the list of of modules for users to select.
See lines 31 – 51 in the code below to locate the module references.
If you are interested in modifications to the Web HMI Dashboard, or would like to speak with us about creating a module specific to your application, Contact Us today!
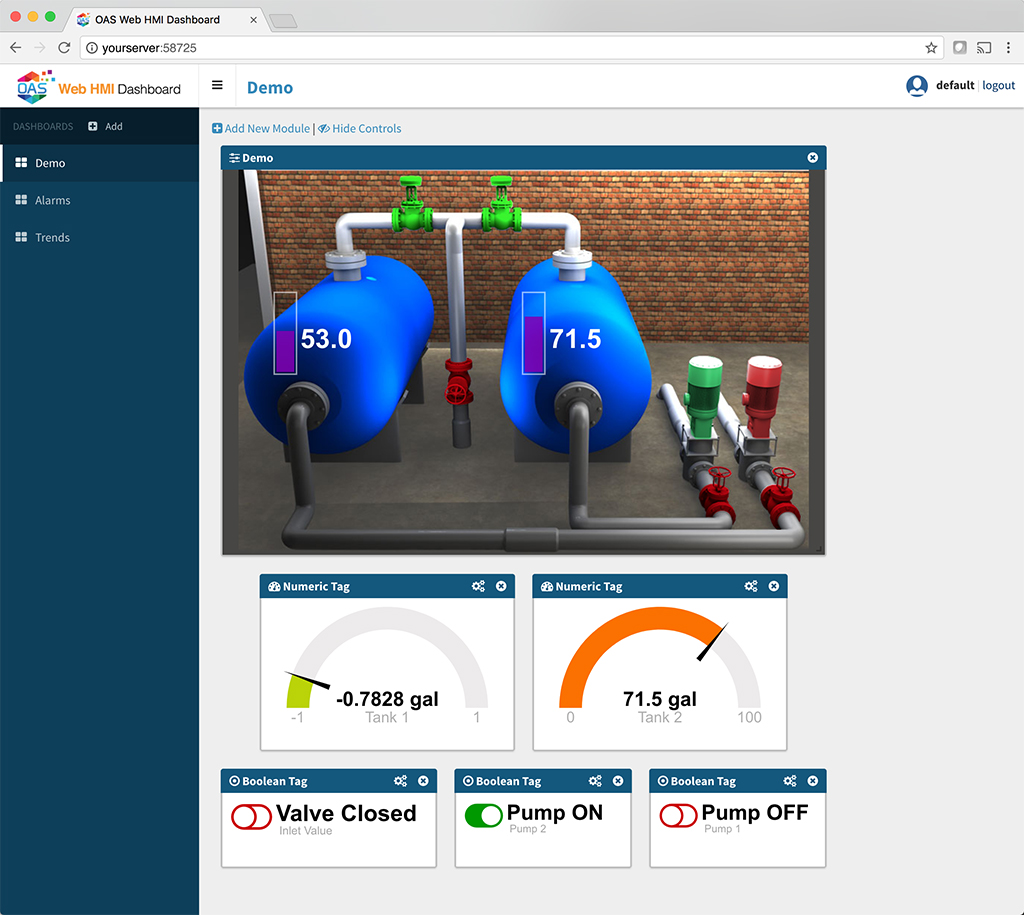
Demo Module
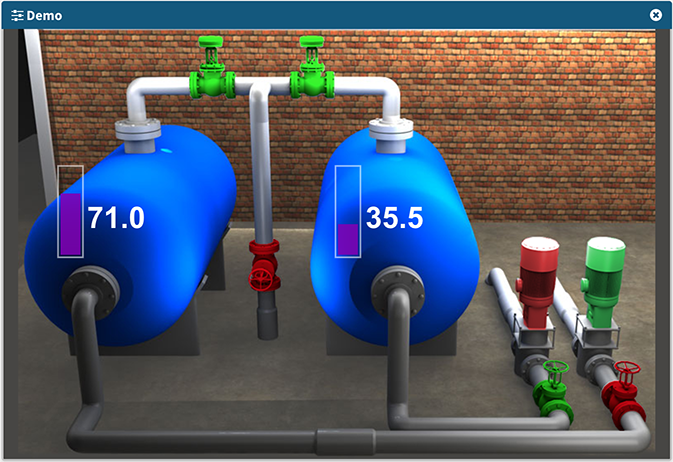
The Demo Module is an example of an interactive, visual representation of a physical system, with pumps, valves, and fluid level sensors. You can click or tap on each of the valves and pumps to simulate fluid flowing into or out of the two tanks. The corresponding tags in the OAS server can be found under the WPF/New Tanks Demo structure that is present in the demo tags included with each installation.
Numeric Tag Module
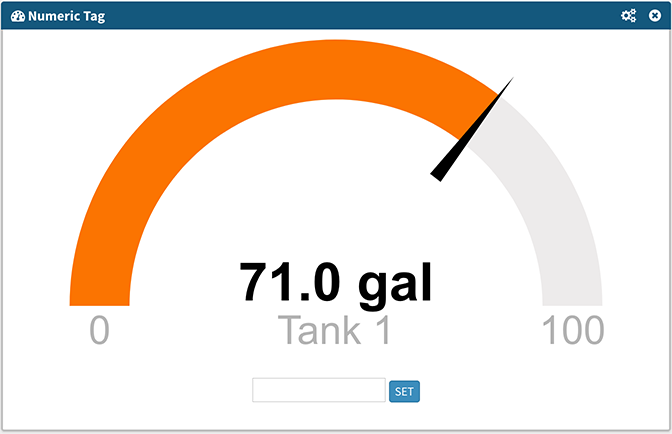
This module allows you to display a real time numeric value rendered as a gauge. As values change, the needle will animate, indicating the current value.can be configured
Configuration settings
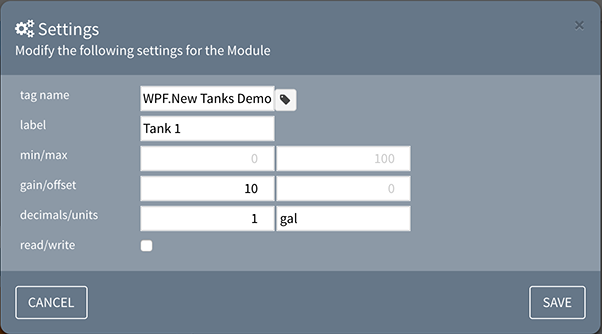
Tag Name: the tag to be visualized – click the icon to browse or manually enter the tag
Label: the text label displayed below the current value
Min/Max: the range that determines the needle position (default: 0/100)
Gain/Offset: optional multiplier and value offset applied to the raw value
Decimals/Units: number of decimal places to display, and unit suffix added to the value
Read/Write: when checked, displays an input field, allowing users to set the tag’s value
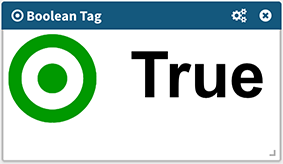
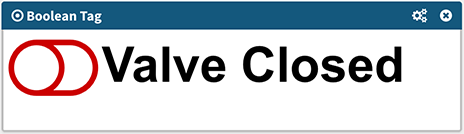
Boolean Tag Module
This module displays the current live value of a Boolean Tag. When configured to allow for read/write access, the display icon becomes a switch. If the switch is clicked or tapped, the server value will be toggled between True and False. The display can also be customized so that True and False text can be replaced with text of your choosing.
Configuration settings
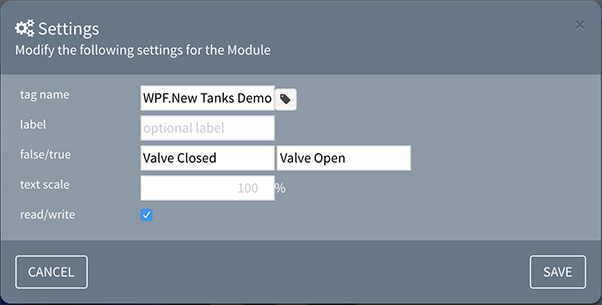
Tag Name: the tag to be visualized – click the icon to browse or manually enter the tag
Label: the text label displayed with the current value
False/True: optional text to display when the value is false or true, respectively
Gain/Offset: optional multiplier and value offset applied to the raw value
Text Scale: optional scaling % applied to text
Read/Write: when checked, changes the indicator to a switch icon and allows the user o toggle the value
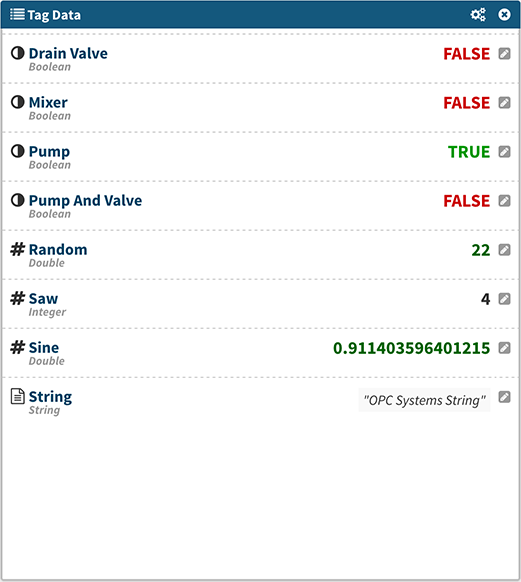
Tag Data Module
This modules allows for the display of multiple server Tags along with their data type and real time values. This is very useful for checking the raw data coming from the server within a single tabular format. This module also allows the end user to modify Tag values when the Read/Write option is enabled.
Configuration settings
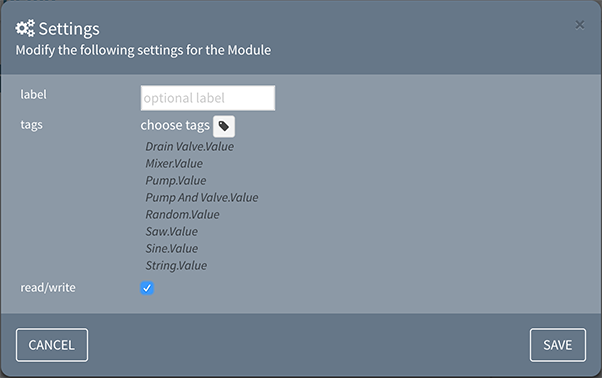
Label: the text label displayed above the grid
Tags: the list of tags to display – click the icon to choose one or more tags
Read/Write: when checked, adds an edit button next to each tag, allowing the user to set the tag’s current value
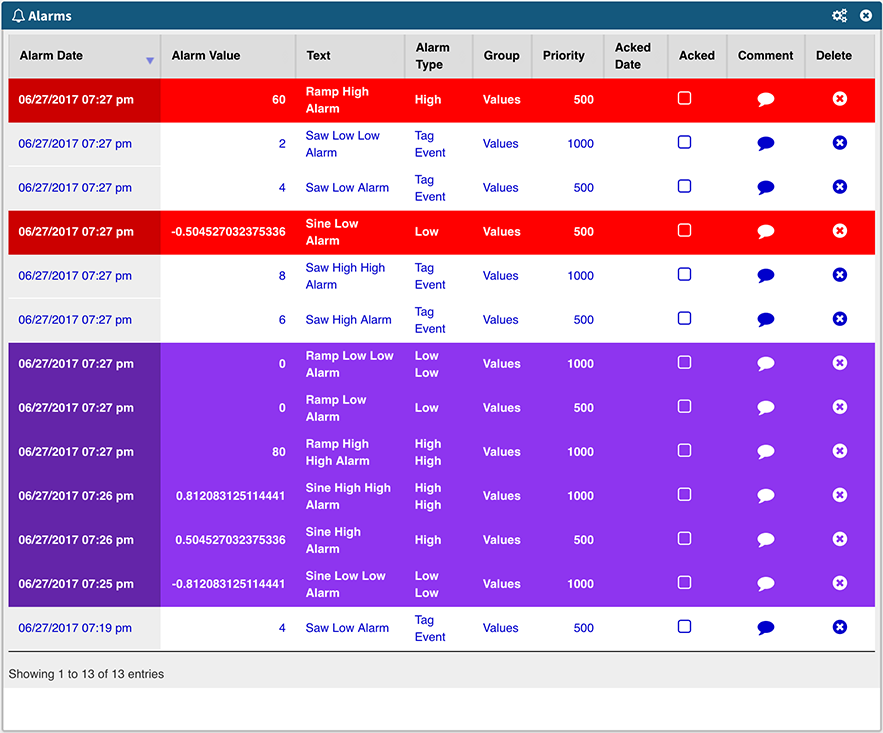
Alarm Module
This module encapsulates the Web Alarm viewer and allows the end-user to configure it to display the columns desired. It also allows users to configure the viewer to filter alarms by type, group, status, and priority. Because it is based on the Web Alarm product, it retains all functionality. See the following for more information on Web Alarm.
Configuration settings
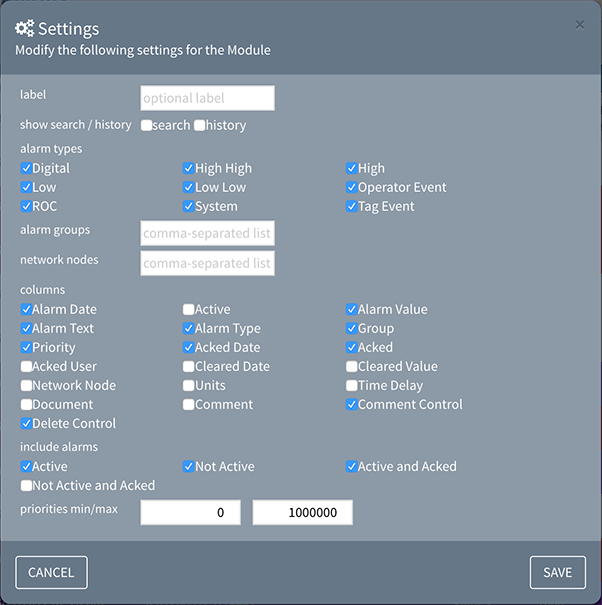
Label: the text label displayed above the alarms
Show Search/History: when checked, display the inline search and historical input fields
Alarm Types: list of Alarm Types to include in the display
Alarm Groups: a comma-delimited list of Alarm Groups to include in the display, defaulting to all if left blank
Network Nodes: a comma-delimited list of Network Nodes to include in the display, defaulting to localhost if left blank
Columns: list of Alarm fields to display in the grid
Include Alarms: list of Alarm statuses to include in the display
Priorities: the min and max priorities to include in the display
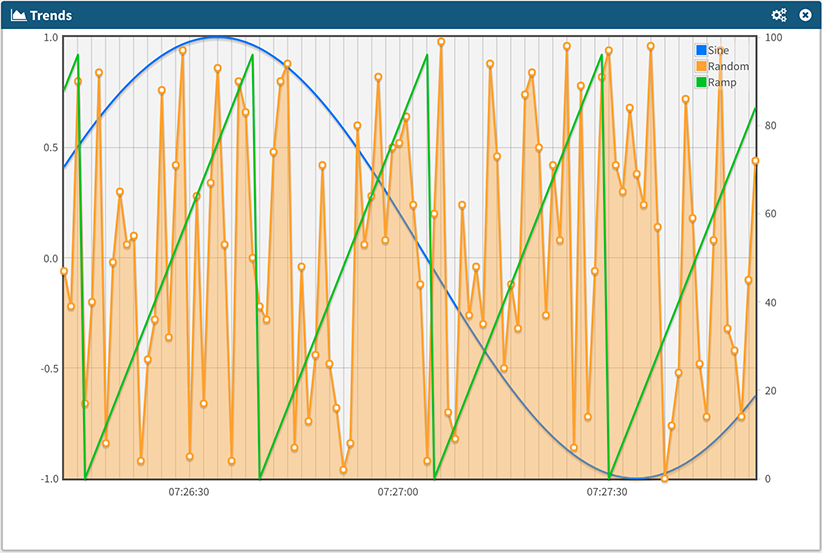
Trend Module
This module encapsulates the Web Trend viewer and allows the end-user to configure it to display a chart plotting both real time and historical trends. Because it is based on the Web Trend product, it retains all functionality, but requires no programming to configure. See the following for more information on Web Trend.
Configuration settings
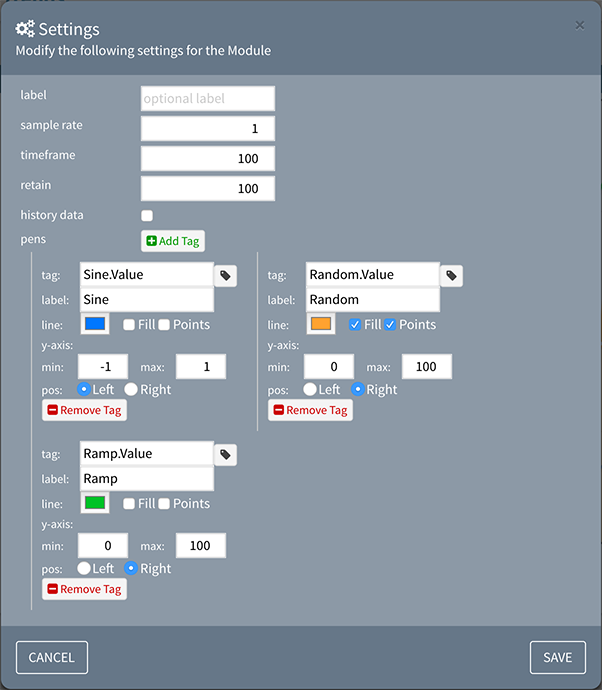
Label: the text label displayed above the chart
Sample Rate: the frequency (in seconds) for each data point to be acquired
Timeframe: the number of seconds in the initial data set
Retain: The number of data points to retain in client memory – as more data is received, the chart will animate as it flushes non-retained values
History Data: when checked, allows users to select start and end dates for displaying historical data
Pens: click Add Tag to add a pen linked to a server tag. Each tag will include settings for Name, Label, Line style, and Y-axis range and position
Custom Module
This module allows you to specify any web URL so you may embed your custom code into the Web HMI Dashboard. You can either host the contents of a Custom module on any web server, or you may also add it to the modules folder in the application itself.
The module has a single parameter of a URL. When you use an absolute URL (containing the full URL such as “http://someurl.com/page”), the module will load from the source. If you use a relative URL (e.g. “somepage.html”) it will be loaded from the Web HMI Dashboard root folder.
This folder is located in the OAS installation directory under /webapps/webhmi.
Note: previous versions of the OAS server located these files within a www directory in the installation directory.
For example, if you create an HTML page titled index.html and you put it in a folder titled “newModule” under the modules folder, set the URL parameter to “modules/newModule/index.html”.
If you are interested in modifications to the Web HMI Dashboard, or would like to speak with us about creating a module specific to your application, Contact Us today!