Download Source Code Examples
If you are are looking for programmatic examples on access configuration, realtime, or historical data refer to the Programmatic Interface section. The .NET WinForm VB and C# examples below also demonstrate all of these methods.
Note: You may need to Unblock the zip file before extracting. To Unblock a file right click in Windows Explorer and select Properties. If Unblock is shown in the lower right select it and Apply.
Web & REST API
Web HMI Demo – Web HTML source of online example at www.opcweb.com
Web HMI Image Example – Web HTML source of image example demonstrating how to incorporate graphics in a web application. See Web HMI Graphics on the step by step instructions
Web HMI Basic Examples – Web HTML examples of HMI, trend, and alarm
Web HMI Security Example for ASP.NET/C# – A simple ASP.NET example in C# demonstrating how to build a login page that persists your authentication token between page views.
Web HMI Security Example for ASP.NET/VB – A simple ASP.NET example in VB demonstrating how to build a login page that persists your authentication token between page views.
Web HMI Security Example for ASP.NET/Javascript – A simple HTML and Javascript example demonstrating how to build a login page that persists your authentication token between page views.
REST API Sample Client (Web) – A sample client that demonstrates how to use JQuery to make calls and receive data from the OAS REST API
How To Use the OAS REST API: Read and Write Live Data, Trend Real-Time and Historical Data and Alarming – HTML and JQuery example interfaces that demonstrate how to Read and Write Live Data (see tutorial), Trend Real-Time and Historical Data and Alarming with the OAS REST API.
.NET
Read Data Asynchronously – C# – C# .NET Core Console App code example for realtime data access.
Read Data Asynchronously – VB – Visual Basic .NET Core Console App code example for realtime data access.
OAS Demo Service Realtime Data Access – VB and C# – .NET Core Console App and Windows Service code examples for programmatic tag creation and realtime data access.
Universal Driver Interface Driver – VB and C# – Example source code to create a driver for OAS
Open Weather Map Example Driver – VB and C# – Example source code for Open Weather Map UDI
REST API Sample Client (WPF) – A sample client that demonstrates how to use .NET and WPF to make calls and receive data from the OAS REST API
Visual Basic WinForm Example Code – for realtime data access and all configurations access
C# WinForm Example Code – for realtime data access and all configurations access
Automated HMI – WPF example of automated setup and self adapting client
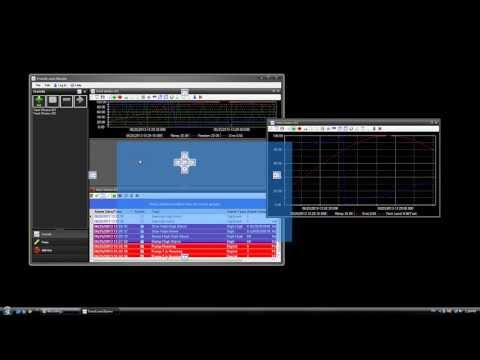
Tanks Demo – WPF Tanks Demo with graphic, trend, and alarm
.NET Examples Launcher (WPF) – An application that will launch other example applications
One Click HMI – WPF application that automatically displays all tag values
Navigation – WPF example of all WPF HMI controls
Conveyor App – WPF example of 3D model
WPF Dashboard – WPF application demonstrating common dashboard controls
WPF Radial Gauge – WPF application demonstrating radial gauge
WPF Radial Gauges – WPF application demonstrating multiple radial gauges
WPF Linear Gauges – WPF application demonstrating multiple linear gauges
Storyboard – WPF application demonstrating storyboard animation
Symbols – WPF application demonstrating use of HMI symbols
PLC Simulation – WPF application simulating PLC I/O
WPF Custom Open Automation Software Tag Browser – Demonstrates adding a tag browser editor to a custom WPF control
WinForm Custom Open Automation Software Tag Browser – Demonstrates adding a tag browser editor to a custom WinForm control
WPF Redundancy Client Example – Demonstrates automated switch to data servers
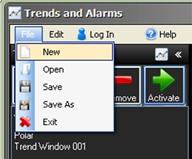
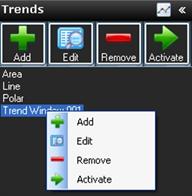
Save Trend Config – Demonstrates how to Save and Load a trend configuration
Multi Line Tab – Creating a WPF application with Multiline Tabs
Pens Visibility – How to hide and show pen line in an Open Automation Software Trend
Trend History Select – How to programmatically display historical data on an Open Automation Software Trend
Content Control – A demonstration of how to use the events in an Open Automation Software Content Control
Alarms Added – How to use the Open Automation Software Alarm control to fire an event for every new alarm and display that alarm
Alarms Data Only Example – How to use the Open Automation Software Alarm Data Only control to fire an event for every new alarm and display that alarm and use GetAlarmDataTable to return a DataTable of current alarms
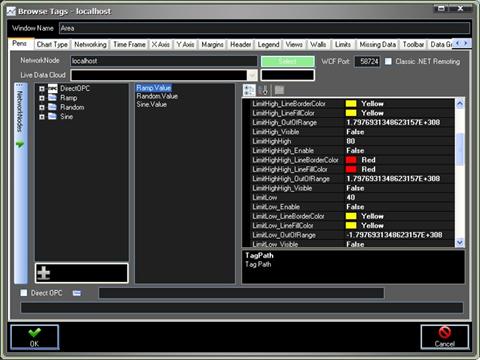
Add Pens – Programmatically Adding Pens to an Open Automation Software Trend (VB)
Add Pen C Sharp – C# example of programmatically adding pens to an Open Automation Software Trend
Tree View Trend – Example of displaying all Open Automation Software Tags in a tree view and adding / removing tags on an OPC Trend Control.
Array Data Emulator – VB – Simulation of logging buffered data from a controller.
iOS/Android
Xamarin OAS Tanks Example – Source code of the iOS and Android demo app displaying real time Tanks and Pumps.
Node Red
Node Red Flow and Dashboard – Example of a Node Red Flow and Dashboard reading from and writing to the OAS MQTT Broker.