Overview & Health dashboard
An at-a-glance status check of every subsystem, with a proactive Configuration Review that catches provable mistakes before they bite, and guided troubleshooting on each tile when something needs attention.

Configure it in a browser, secure it end to end, and run it faster. OAS Platform 22 adds a full browser-based configuration app, TLS across every interface, a complete ISA-18.2 alarm management workflow, direct streaming into Snowflake, an AI-ready endpoint and an optimized engine, so the same hardware does more and the system explains itself as you build it.

A version number beside a feature is the release it first appeared in. Features without one arrived with the first Platform 22 release.
Web Configuration App
A full, browser-based configuration tool for local or remote engines: tags, drivers, logging, alarms, security and recipes, plus a health dashboard, a live watch window, and guidance that lives right on the form.
An at-a-glance status check of every subsystem, with a proactive Configuration Review that catches provable mistakes before they bite, and guided troubleshooting on each tile when something needs attention.
A spreadsheet-style editor: pick the columns you care about, find and replace across the grid, paste a block straight from Excel, and apply to every tag in one operation instead of editing them one at a time.
When a driver won't connect or tags read Bad, the Overview doesn't just report it. It walks a protocol-specific decision tree to the fix, answering every step it can and pausing only for the checks that need a person on site. Every path ends at a specific fix or a one-click support package.
A proactive linter flags provable mistakes at configuration time, naming each one on the form before you rely on it, instead of leaving you to chase a silent failure later.
A Get Started roadmap on every page and an information icon on every field, with descriptions drawn from the engine itself, so the help is always accurate and never drifts out of date.
Target the local engine or any OAS node on your network from the node selector, and configure multiple systems from one place, alongside the desktop tool if you prefer.
A Data Flow tab on every tag, driver, logging group, data route and alarm notification draws where its data comes from and everywhere it goes, with any break in the chain flagged in red. Expand traces the full path across every hop, each tag shows its live value, and the interfaces using a tag right now appear as observed nodes. See how Data Flow works.

Security & Certificates
A new Secure Comms page brings TLS to every interface, a Certificates hub makes the whole certificate picture visible and warns before anything expires, and OAS can now create certificates and set up mutual TLS in a single step, because it owns both ends. Three tools on the Certificates page cover the jobs that used to mean leaving OAS: changing a certificate's format, getting a CA-signed certificate in place, and finding out why a TLS connection fails.
Each interface is shown with its live posture and a one-step path to lock it to secure-only, actively closing the plaintext port instead of just offering an alternative.
Every certificate OAS uses in one list, with days to expiry and status. A daily sweep warns at 30, 14 and 7 days and raises a real alarm, so a certificate never quietly expires and drops a connection.
Create a certificate in the app without OpenSSL, with SANs pre-filled from the host. Trust a client on the OAS MQTT broker or OPC UA server in one click, with nothing to copy between machines.
SQL Server is always encrypted; PostgreSQL, MariaDB and MongoDB gain a simple Enable SSL. One Trust Server Certificate switch governs them all, and nothing changes until you ask.
Validate a database connection against a certificate you trust, scoped to one server and reversible, with no changes to the Windows trust store and no effect on anything else.
Paste a PEM or pick a file, add a separate key if the parts are in two files, and download the result in the format the field wants. It changes no configuration.
Generate a signing request and its private key for your certificate authority, or on Windows pick a certificate already installed on the machine by its thumbprint.
Connect to a host and port and see whether TCP connects, the handshake completes, the certificate is trusted and the name matches. Also on the MQTT, Sparkplug B, AWS IoT and MTConnect driver forms.
Alarm Management
Four screens take an alarm system from noisy to rationalized, to the ISA-18.2 and EEMUA-191 standards: measure it, decide which alarms should exist, see everything that has been silenced, and put the agreed response in front of the operator. It all runs on the configuration and alarm history OAS already holds, with no cloud, so it works on an air-gapped system.

A guided walkthrough for a non-expert. Set your site's alarm philosophy once, then work a list seeded from every configured alarm limit, answering only the questions that need a person. Priority is derived from your own consequence and time-to-respond matrix, written to the live tag and recorded in a Master Alarm Database.

Scores average alarm rate, peak rate and time in flood against the EEMUA-191 targets, ranks the alarms causing most of the load, and proposes a previewed fix for each one that never weakens the trip point. It then measures the rate before and after the change, with a one-click revert.

One inventory of every alarm that is disabled, shelved, demoted to an event or silenced on a schedule, with flags on the risky ones: no expiry, a Critical alarm, or a long time suppressed. Shelve a nuisance alarm for a set number of minutes with guardrails enforced by the engine, and it expires on its own.
A full-screen operator surface, not a configuration page. Each live alarm is colored by tier and shown with the cause, consequence and response your team recorded during rationalization, so the person facing the alarm does not have to hunt for a procedure.

Data & Connectivity
Push alarms to the tools your team already uses, see exactly when data is buffered and when it is lost, test a connection before you rely on it, and move a whole working configuration to a new machine in one operation.

Alongside email, SMS and voice, post alarms straight to a chat channel, or to any JSON webhook for automation platforms and ticketing. Acknowledge right from the card, attributed and audited.
When a database drops or a broker is unreachable, OAS buffers and forwards, and now shows it, instead of hiding real data loss behind a generic error.
Test a database connection, verify the table or stored procedure against your field map, and see recent rows before saving. Read-only, and safe while logging is running.
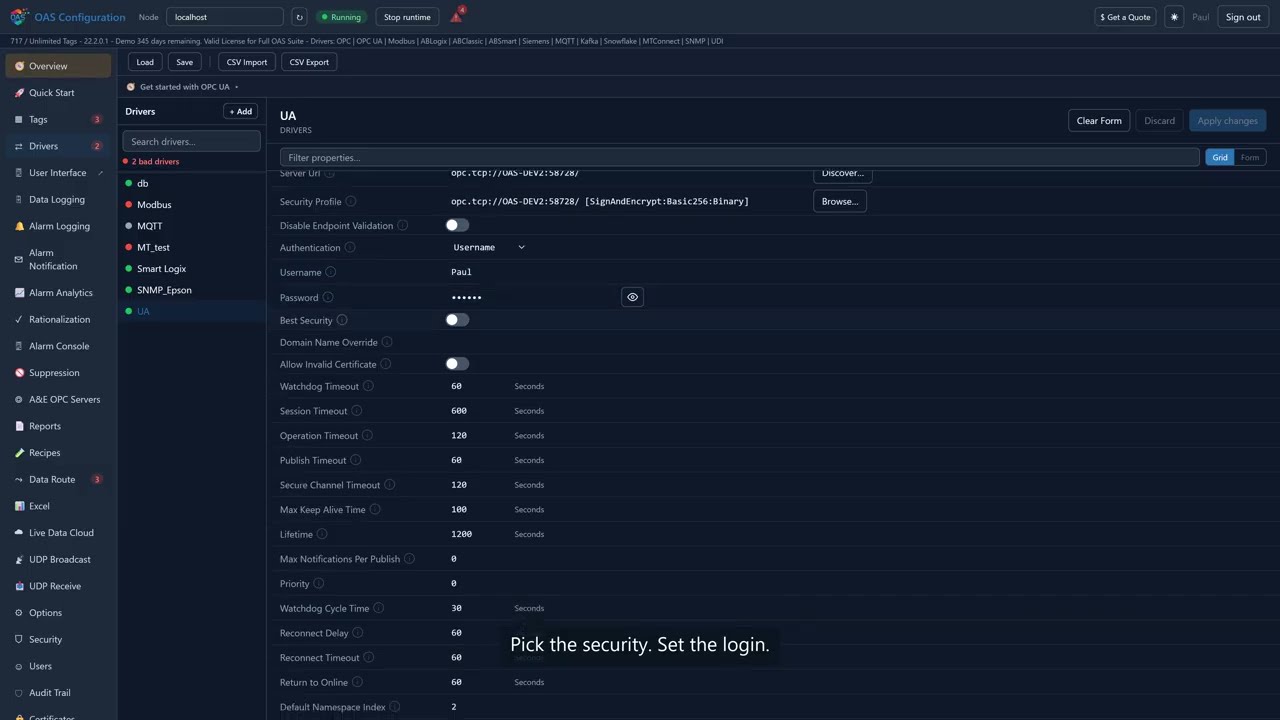
Enter a host and let OAS find the OPC UA servers on it, then pick one, instead of typing the full opc.tcp:// endpoint URL by hand.
Package a complete working configuration into one AES-256 archive and restore it on a new machine, or pull it straight from a connected engine with no file to move. The target backs itself up first, so it is reversible.
Calculations & Diagnostics
An assisted editor makes long, deeply nested calculations readable, a Bad calculation now explains what is wrong with it, and Data Routes, Recipes and Data Logging report the problems that used to pass silently.
A searchable function reference, tag autocomplete, syntax highlighting and parentheses colored by nesting depth. A chain of nested IFs opens as a decision table with one row for each condition and its result: add, delete and reorder rows, and the expression is rebuilt underneath.
A Calculation Health panel on the tag checks the formula, the type of its result against the tag's Data Type, and every tag it references. When a Bad source tag drags the calculation Bad with it, the engine names the source.
A health panel on the Data Route shows whether values are flowing: the status of the source and destination tags, and whether the route is enabled and transferring. A guided troubleshooter and configuration checks find the cause when it is not.
A recipe or logging group that references a tag that does not exist is flagged on the form as you configure it. At runtime it logs a system error and turns the group's status red, where the write used to be skipped without a word.
Drivers
A new Snowflake driver writes live data directly into your tables over Snowpipe Streaming, and the Kafka driver now speaks Schema Registry and Avro, so every message is compact, typed and understood by whatever consumes it. The MQTT driver can publish against a schema as well, and a new SNMP driver brings in network devices such as switches, routers, UPS and printers. Every driver that supports failover can now report which connection it is running on.
Stream tag data directly into Snowflake through the high-speed Snowpipe Streaming REST API, with no staging files, no batch loads and no middleware to maintain. Map each field to the table column it belongs in, and every row travels over an encrypted connection.
Register and validate message schemas with Schema Registry support, map OAS data to your schema field by field, and send it as compact Avro binary instead of text, so the same data uses less bandwidth and downstream consumers know exactly what they are reading.
The MQTT driver gains an Output Format. Publish in the built-in ISA-95 Lite unified namespace schema or in an AVRO schema of your own, mapped field by field in the same dialog the Kafka driver uses and sent as JSON text. The OAS MQTT broker serves a tag in a schema's format too, when a client adds the schema's name to the topic.
High-performance symbolic access to ControlLogix and CompactLogix over EtherNet/IP, with multi-tag batching, bad-tag isolation and adaptive polling that protects the PLC without hand tuning.
Bring any device with an SNMP agent into OAS over SNMP v1, v2c or v3, with SNMPv3 authentication and encryption. Discover devices on a subnet, create standard tags for what a device actually has, and browse its OIDs by name from the standard MIBs built into OAS, or from a vendor's own MIB files. Traps update a tag the moment an event happens, and writes are read back so the tag shows what the device really holds. See the SNMP driver.

A Boolean tag that is True while a driver is running on its failover parameters and False while it is on its primary. Because it is an ordinary tag you can alarm on it, trend it, log it or route it, so a switch to the backup PLC, broker or server is seen the moment it happens. It is available on every driver that supports failover.
Performance & AI
The engine was optimized end to end for higher throughput and steadier memory, an OPC UA browse that used to stall for minutes now returns in seconds, AI assistants can read live data over MCP, and a tamper-evident Audit Trail answers what changed, and who changed it.
Hot paths across driver polling, tag processing, logging and IoT publishing were reworked to cut CPU and memory churn. An OPC UA client that walked the address space at connect used to wait 90 seconds or more; the browse is now serviced in-thread.
A Model Context Protocol endpoint lets AI assistants and tooling read OAS data directly, now with its own TLS listener on a configurable secure port, served with the node's own certificate.
Every configuration change and operator action, chained with SHA-256 so any edit to the record is detectable: who, what, when, from which app and host, with before and after values for each item.
Host and engine health - CPU, memory, disk, network and garbage collection - as ordinary OAS tags sampled once a second. Trend, log, alarm on and route them like any device tag.
Configuration from any browser, encryption on every interface, a faster engine, and an audited record of it all, adoptable at your own pace, with nothing turned on until you ask.
See how OAS fits your environment, or get pricing for your project.