New in 22.2.0.1Open any item and OAS draws its data lineage in context: the sources that feed it, the tag or group itself, and everything that consumes it, with any break in the chain flagged in red. It answers the question to ask before every change, "if I change this, what else is affected?", without tracing references by hand.
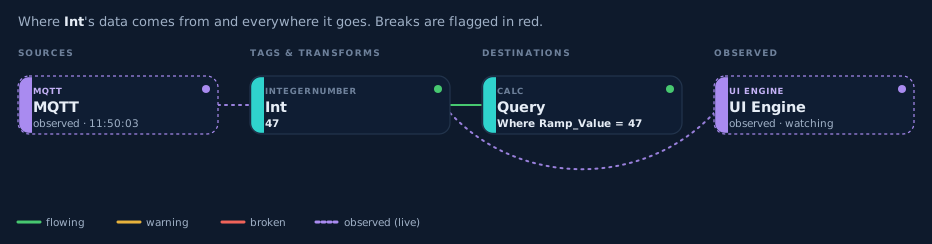
- Every item Tags, drivers, data and alarm logging, data routes and notifications
- Both directions Where the data comes from and where it goes, from either end
- Zero config Nothing to draw or maintain
The Data Flow Tab
In a working system a single tag can be written by a driver, read by three logging groups, alarmed in two notification groups, used in a calculation, written again by a recipe and published to an MQTT broker the whole time, and none of that shows on the tag's form. The Data Flow tab shows it. Sources are on the left, the item and any transforms in the middle, and destinations on the right, joined by animated links that read at a glance: green is flowing, amber is a warning, red is a break and gray is disabled.
It is a tab on the item, not a separate tool. Open a tag to see the driver or interface that writes it and every place its value goes; open a driver, a logging group or an alarm group to see the same from that end.
- Tag
- Driver
- Data Logging
- Data Route
- Alarm Logging
- Alarm Notification
When a driver cannot talk to its device, its tags and their links turn red and the Issues list names the cause. A referenced tag that is not in the configuration shows as a red missing node, so a silent gap becomes obvious.
- Flowing
- Warning, such as an empty destination group
- Break, or a missing tag
Full Path
The tab shows one hop, so it stays readable. When a path continues past it, a hint appears and the Expand button pulses. Expand traces the whole connected lineage, laid out left to right by distance from the item you opened and fitted to the screen, wrapping a long path onto a second row instead of scrolling sideways. Here an MQTT message lands on a tag, a calculation reshapes it, a recipe writes the result, and it fans out to the tags it lands in.
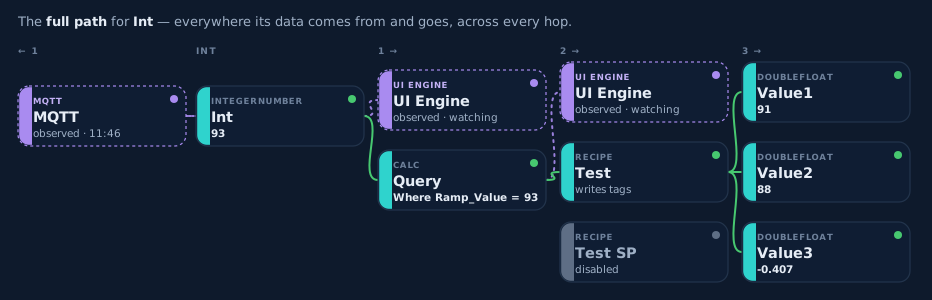
Hover any node for a one-line explanation of what it is and how it relates to the item you opened. Click it for a details card with its type, name, live value and quality, and the relationship in plain words, and an Open button that takes you to that item's own configuration. Follow a flow from a tag, into the calculation that reads it and on to the recipe beyond, each a click away, without hunting through the tree.
Live
Beyond the configured links, Data Flow shows the current value on each tag and the external interfaces using it at that moment. It turns "this is how it is configured" into "this is what is happening to it now", which is usually the faster way to find why a value is moving, or why it is not.
Each tag on the diagram shows its current value, updating as it changes, over the same push the UI Engine uses, scoped to the tags on screen and closed when you close the tab. A tag reading Bad quality shows its value in red, so a stalled source or a calculation error stands out in the picture itself.
The interfaces using a tag show as dashed observed (live) nodes: MQTT publishing to it, an OPC UA or .NET client subscribed, the UI Engine displaying it, or a REST call that just read it. Live Data Cloud connections are not shown yet.
- MQTT
- OPC UA
- UI Engine
- REST
- .NET and binary clients
The Issues panel beside the diagram merges Config Review's configuration findings with live runtime problems. Click one and it lights up exactly the nodes and links it affects.
Under the Hood
The flow and every break come from Config Review, the same engine that validates your configuration, so the picture shows exactly how OAS has resolved each reference and stays correct as the configuration changes. Opening the tab is a read of work already done. Only the small live overlay, the values of the tags on screen and the observed interfaces, is live, and only while the tab is open. The observed interfaces are captured at the interfaces OAS already owns, with no change to how fast tags run, and an idle interface costs nothing.
See Data Flow in action
See how OAS fits your environment, or get pricing for your project.